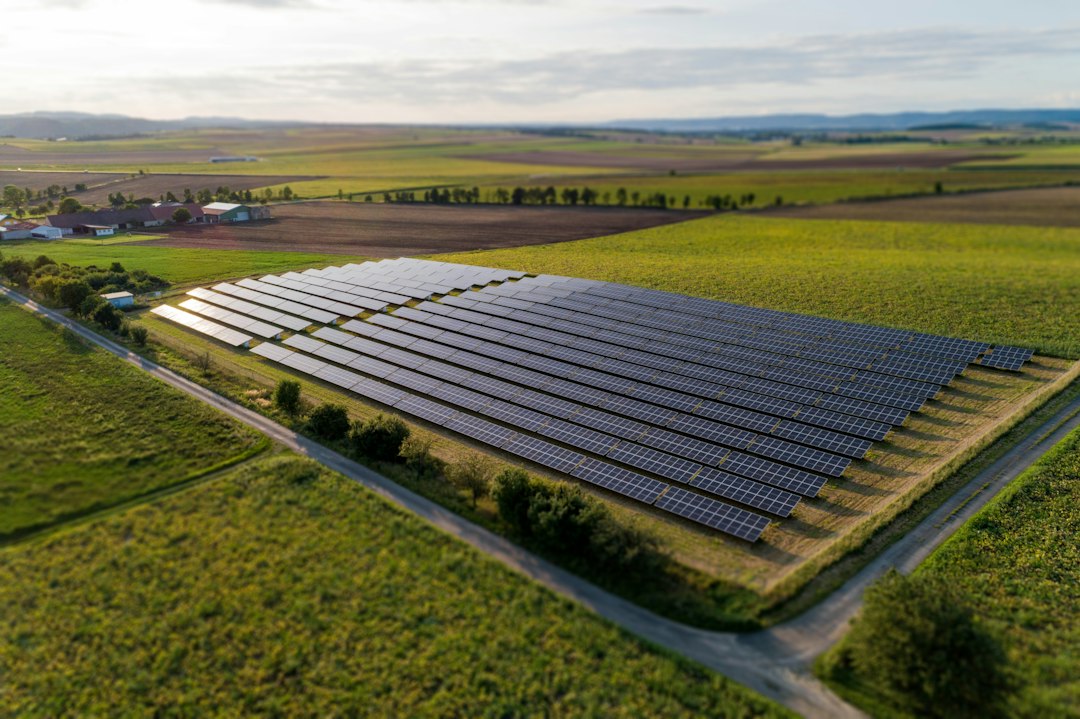
Thermal mapping with a drone means flying a grid with a thermal camera and stitching hundreds of infrared photos into one georeferenced temperature map. Done right, every pixel holds a real temperature you can measure. Done wrong, you get a colourful picture that proves nothing.
The camera is the easy part. What decides whether the map is useful is when you fly, whether the photos keep their temperature data through processing, and whether the finished map comes with enough documentation for a client to act on it.
One note on the term first: in pharma and cold-chain logistics, "thermal mapping" also means placing data loggers around a warehouse or freezer to prove temperature stays in range. That is a different discipline with different standards. Everything below is about the aerial kind.
Table of contents
- What thermal mapping is (and what it is not)
- When to fly: the timing window decides the result
- Night thermal mapping and the rules that come with it
- Flight settings for a thermal map that stitches
- Keeping the temperatures: radiometric processing
- How accurate is a drone thermal map?
- What a thermal mapping deliverable should contain
- Running thermal mapping as a repeatable service
- Frequently asked questions
What thermal mapping is (and what it is not)
Thermal mapping is the production of a georeferenced, top-down temperature map from overlapping infrared photos, usually as a thermal orthomosaic. It differs from thermal imaging, where a pilot looks at a live feed or captures individual frames of a specific target.
A single thermal photo tells you a breaker is hot. A thermal map tells you where every warm area is across a 40,000 square foot roof or a 20 MW solar site, how big each one is, and how it sits relative to everything else. It also lets you fly the same site next year and compare.
There are really two products that both get called a thermal map:
| Output | What each pixel holds | What you can do with it |
|---|---|---|
| Colourised thermal mosaic | An RGB colour from a palette | Look at patterns. You cannot read a temperature from it. |
| Radiometric thermal map | A temperature value (usually °C or °F) | Measure spots and areas, set thresholds, compare against surroundings, re-palette later |
Only the second is a measurement. Clients rarely know to ask for it, so it falls to the operator to deliver it. If you are still choosing hardware, our thermal drone buyer's guide covers radiometric versus non-radiometric cameras in detail.
When to fly: the timing window decides the result
The right time to fly a thermal map depends entirely on what heat difference you are trying to see, and the window is often only an hour or two wide. A perfect flight at the wrong time produces a flat, featureless map.
Thermal cameras do not see defects. They see temperature differences. Each application depends on a specific physical process creating that difference, and that process only happens under certain conditions:
| Application | When to fly | Why it works then | Conditions to check |
|---|---|---|---|
| Low-slope roof moisture | From about an hour after sunset, into the evening | Wet insulation holds the day's heat longer than dry insulation | A sunny day beforehand, dry roof surface, clear sky, light wind |
| Solar PV | Middle of the day | Faulty cells and strings run hotter than healthy ones under load | Stable irradiance above 600 W/m² in the plane of the array |
| Building envelope heat loss | Cold season, before sunrise | Heat escaping from inside shows at gaps and missing insulation | Large indoor-outdoor temperature difference, no sun on the walls |
| Electrical and substation assets | During normal or peak demand | Resistance at bad connections produces heat only under current | Meaningful electrical load; record it |
| Water, seeps and buried leaks | Pre-dawn | Water and ground cool at different rates overnight | Calm air, no recent rain |
Roof moisture surveys follow ASTM C1153, the standard practice for locating wet roof insulation with infrared imaging, which covers ground-based and aerial surveys at night. After a sunny day, dry insulation loses its heat quickly once the sun goes down while wet insulation keeps radiating it. Wind strips heat from the surface and flattens the contrast. Clouds reflect heat back down and slow the cooling. The standard also calls for infrared findings to be verified with invasive test methods, such as roof cores, which is worth putting in your scope of work up front. Our drone roof inspection guide covers the rest of that workflow.
Solar sites are the opposite: you fly in daylight, because the modules must be producing. IEC TS 62446-3, the technical specification for infrared thermography of PV plants, sets a minimum image resolution of 5 × 5 pixels per cell, which works out to about 3 cm per pixel on a 6-inch cell. For irradiance, the IEA PVPS review of infrared imaging for PV plants recommends capturing above 600 W/m² in stable, cloud-free conditions. Our solar panel inspection guide walks through the standard in more depth.
So thermal mapping jobs cannot be slotted into whatever day is free. The go or no-go call depends on the previous day's weather as well as the forecast for the window. See our guide to weather for professional drone operations for how to build that decision into your planning.
Night thermal mapping and the rules that come with it
Night thermal mapping is legal for US commercial operators under Part 107 without a waiver, as long as the aircraft carries anti-collision lighting visible for at least 3 statute miles and the remote pilot's knowledge test or training is current. Because roof moisture and building envelope surveys are night jobs by nature, these rules come up constantly.
The requirement sits in 14 CFR 107.29. The same lighting requirement applies during civil twilight. You can dim the light if safety calls for it, but you cannot switch it off. Controlled airspace authorisation through LAANC still applies at night, and so do visual line of sight and every other Part 107 rule.
In the EU, open category operators must keep a green flashing light on the aircraft switched on during night flight, a requirement added to Regulation (EU) 2019/947 by Implementing Regulation (EU) 2020/639. Our EASA compliance guide covers the wider framework.
The legal side is the easy part. The operational side is where night thermal jobs go wrong:
- Walk and plan the site in daylight. Antennas, guy wires, rooftop units and trees are invisible in the dark. Build and check the mission in daylight, then fly the saved mission at night.
- Fly a separate visible-light pass in daylight. A night RGB map is nearly useless, so a roof moisture job usually needs two flights: a daytime visible map for context and measurements, and the night thermal map for the moisture pattern. Plan both as one job.
- Put a visual observer on the roof edge side. Depth perception at night is poor, and a thermal map over a building often runs close to parapets and equipment.
- Record the conditions. Sunset time, cloud cover, wind, air temperature and the weather of the previous day all belong in the job record. They are part of the evidence, as covered below.
Our drone flight planning guide has a fuller pre-flight process that adapts well to night work.
Flight settings for a thermal map that stitches
Thermal maps need far more overlap than visible-light maps: around 90% front and side overlap is the standard starting point. Thermal images are low resolution and have little texture, so the software struggles to match them.
Pix4D's thermal processing guidance lists 90% front and side overlap as a requirement for thermal datasets, with around 95% for difficult ones. Compare that with the 75 to 80% typical of a visible-light map. A uniform surface such as a flat membrane roof or a field of identical panels is the hardest case of all, because every frame looks the same.
Altitude comes from ground sampling distance (GSD), not habit. GSD is altitude multiplied by pixel pitch, divided by the lens's actual focal length. For a typical 640 × 512 thermal camera with 12 µm pixels and a lens around 12 mm, that works out to roughly 1 cm of GSD for every 10 m of altitude. So a solar survey that needs about 3 cm per pixel to meet 5 × 5 pixels per 156 mm cell is flown at around 30 m, while a roof moisture survey looking for areas several metres across can go higher. Always check your own camera's numbers; "super resolution" modes that upscale the image do not change the native pixel count behind the temperature data.
Other settings that matter:
- Slow down. Thermal sensors are more prone to motion blur than visible cameras. Lower speed also helps reach high overlap without an extreme shutter interval.
- Lock the camera settings. Keep the gain mode and temperature range fixed for the whole flight. A change halfway through makes the map inconsistent.
- Warm the payload up. Uncooled thermal cameras drift as they settle to temperature. Power up a few minutes before the mapping leg starts.
- Watch reflections. Glass and bare metal reflect the sky and the sun. On solar sites, a reflected sun looks exactly like a hot spot. Adjust flight direction or gimbal angle slightly if reflections appear in the frames.
- Fly the visible camera at the same time if you can. Dual-sensor payloads capture a matching visible photo with every thermal frame. Those visible photos help alignment and give the client a picture they can recognise.
Ground control points or RTK positioning improve absolute position, which matters when a thermal map has to line up with a visible map or with last year's survey. Heated or foil-backed targets are sometimes used so the points stand out in the thermal image.
Keeping the temperatures: radiometric processing
A radiometric thermal map is only possible when the source photos carry temperature data and the processing software reads it. If either link breaks, the output is a colourised picture with no temperatures in it.
Most current DJI enterprise thermal cameras save R-JPEG files: a normal-looking JPEG with the temperature data embedded. Other manufacturers use radiometric TIFFs or their own formats. Pix4D states plainly that plain JPEG thermal images are treated as RGB, and that temperature values cannot be extracted from the resulting map. The same applies to screenshots, video frames and anything exported through a photo editor.
Three parameters decide whether those temperatures mean anything:
- Emissivity. How efficiently a surface emits heat. Most roofing membranes, concrete, wood and vegetation sit around 0.90 to 0.95, which cameras handle well. Polished or bare metal is very low, so it mostly reflects its surroundings and reads far colder than it is.
- Reflected temperature. What the surface reflects back into the camera. At night under a clear sky, that is a very cold sky, which pulls readings down on low-emissivity surfaces.
- Distance and humidity. The atmosphere between camera and target absorbs some infrared energy, so the software needs flight height and relative humidity to correct for it.
DJI's Thermal Analysis Tool 3 lets you batch-edit distance, humidity, emissivity and reflected temperature across a whole set of R-JPEGs before mapping. Whatever values you use, write them down. A thermal map without its parameters cannot be reproduced.
One more thing that catches people out: the mosaic is for finding, the original frame is for measuring. When software blends overlapping photos into a map, it combines several readings of each spot. That is good for a clean map, but it can soften the peak temperature of a small hot spot. For anything that will be quoted in a report, such as a failed cell or a hot connection, check the temperature in the original frames that captured it. More on processing trade-offs in our drone data processing guide and photogrammetry software guide.
How accurate is a drone thermal map?
A drone thermal map is only as accurate as the camera, and a current uncooled enterprise camera such as the DJI Matrice 4T is specified at ±2°C or ±2% of the reading, whichever is greater, in high gain mode. That is good enough to find anomalies but not good enough to treat absolute temperatures as precise.
DJI's published Matrice 4 series specs list ±2°C or ±2% in high gain and ±5°C or ±3% in low gain for the Matrice 4T. Those are manufacturer figures, and real-world error can be larger when emissivity or reflected temperature is set wrong.
This is why professional thermography classifies findings by temperature difference, not absolute temperature. A module 20°C hotter than its neighbours is significant whatever the exact readings are. The practical rules that follow:
- Report anomalies as a difference from comparable surroundings (the same material, the same exposure).
- Do not compare absolute temperatures between two surveys flown on different days and treat small changes as meaningful. Compare the anomaly pattern and its temperature difference instead.
- Make sure each target is several pixels wide. A hot spot that covers one pixel is averaged with its surroundings and reads cooler than it really is.
- Use low gain only when you need the higher range, such as very hot electrical equipment, and expect less precision.
What a thermal mapping deliverable should contain
A professional thermal mapping deliverable combines the radiometric map, a readable visual version, a list of anomalies, and a record of the conditions and settings used. The conditions record is what makes the findings defensible if they are questioned later.
A complete package typically includes:
- Radiometric GeoTIFF. The temperature map itself, with a temperature value per pixel, openable in GIS tools.
- Colourised thermal map with a fixed legend. Choose the palette and temperature span deliberately and print the scale on it. An auto-scaled palette exaggerates small differences on a uniform roof.
- Paired visible-light map. So the client can see what each warm area actually is.
- Anomaly register. Each finding with location, size, temperature difference from surroundings, severity, a thermal crop, a visible crop and a recommended action.
- Conditions and settings log. Date, time, air temperature, humidity, wind, cloud cover, irradiance (for solar), load (for electrical), camera, gain mode, emissivity and reflected temperature values.
- Limitations statement. What the method cannot see, and which findings need verification, such as the invasive checks that ASTM C1153 calls for on roofs.
That last point matters for liability. A thermal map shows surface temperature patterns. It does not diagnose. Wording findings as "anomalies consistent with wet insulation, verification recommended" rather than "wet insulation" protects both you and the client. Our guide to insurance and liability for drone services covers errors and omissions exposure, and quality assurance in drone inspections covers review processes before anything goes out.
Running thermal mapping as a repeatable service
Thermal mapping works as a service when the narrow flight windows, paired flights and processing steps run as one repeatable process. A daytime visible flight and a night thermal flight at the same site belong on one job record, with one conditions log, and night pilots need current training on file.
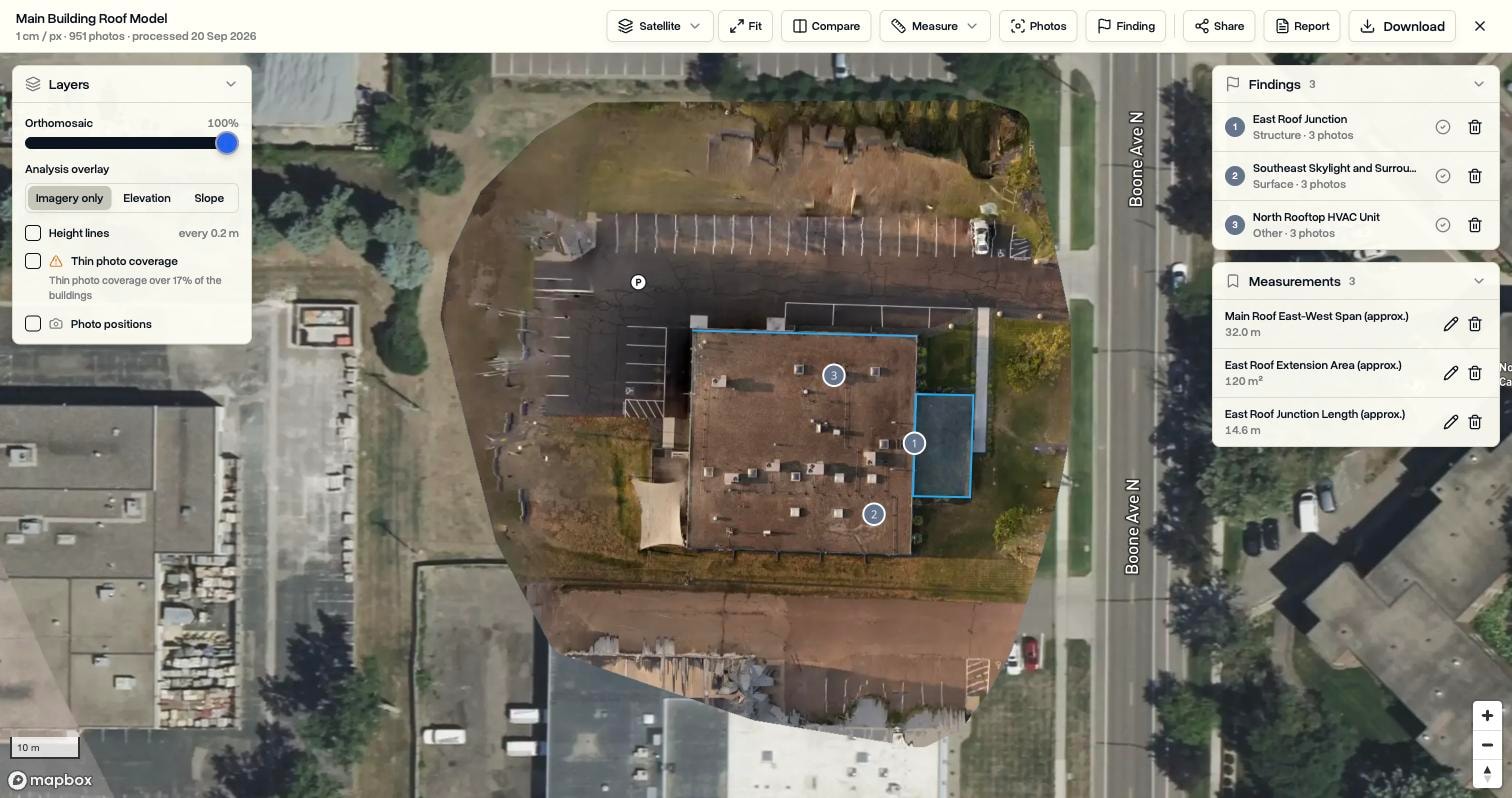
DroneBundle's 3D Scans feature handles the processing and delivery end inside the same job the flight was planned and logged on. The Thermal map output builds a temperature map from supported DJI thermal photos that carry temperature data, reading the real temperatures rather than stitching coloured pictures. You can change the palette, narrow the range and highlight everything above a chosen temperature. An outlined area records its average, lowest and highest temperature and how much warmer or cooler it is than its surroundings, which is the temperature difference thermography reports are built on.
When the same site also has a visible-light scan, DroneBundle pairs the two. Findings appear on both, and the report can show the thermal and visible crops of each finding side by side. The 3D Scans announcement walks through the full workflow.
Around that, weather integration helps with go or no-go calls, pilot assignments sit on the same job, and the client portal gives recurring clients one place to see every survey. Teams that sell thermal work to solar and grid owners will find more on that sector on our utilities and energy page, and roof and building work is covered under surveying and inspection. If you are building the business side, see our guide to starting a drone thermal imaging business.
3D Scans is included with Enterprise, with 200 processing credits a month, and with every free trial, which comes with 20. One credit covers up to 100 photos, so a 450-photo thermal roof set uses 5 credits. See pricing for plan details.
Frequently asked questions
What is the difference between thermal mapping and thermal imaging?
Thermal imaging is capturing or viewing infrared images of a target, usually one frame or a live feed at a time. Thermal mapping stitches many overlapping thermal photos into one georeferenced map of a whole site. Mapping is better for large areas, measuring the size of anomalies, and comparing surveys over time.
Can a thermal map see through roofs or walls?
No. Thermal cameras measure surface temperature only. They detect problems underneath a surface indirectly, when those problems change the surface temperature, such as wet insulation holding heat under a roof membrane or missing insulation letting heat escape through a wall. That is why timing and conditions matter so much.
Do I need a certification for drone thermal mapping?
In the US you need a Part 107 remote pilot certificate for any commercial drone flight, including thermal mapping, and current training to fly at night. No FAA rule requires a separate thermography certificate. Many clients, especially in roofing, solar and electrical work, expect a Level 1 or Level 2 thermographer certification, and it makes your reports more credible.
Ready to turn thermal flights into client-ready maps?
Thermal mapping jobs have tight windows, paired flights and findings that have to hold up to scrutiny. DroneBundle keeps the flight plan, pilot assignments, weather checks, radiometric thermal map, findings and client report on the same job, so nothing gets lost between tools.
Start your 14-day free trial and process your next thermal flight with the 20 included scan credits, no credit card required. Or book a live demo to see a thermal map, its paired visible scan and a finished report in action.