Upload the photos from a flight, press Start 3D scan, and DroneBundle turns them into a map you can measure, a 3D model you can orbit, or a temperature map. Mark what you found, pull up the original photos of any spot, and hand the client a report or a link. The photos never leave the job they were flown for.
A mapping flight ends with a memory card full of photos, often several hundred of them, sometimes more than a thousand. On their own they are not what the client asked for. The client asked for a roof area, a condition report, a before and after, a model they can look around. Getting from the photos to that answer has usually meant a second piece of software, a second subscription, and a second copy of the files.
So the photos get uploaded to the job for safekeeping, then downloaded again and uploaded somewhere else for processing. The map comes back in one tool, the measurements live in another, the report gets assembled by hand, and the job record that started it all only ever holds the raw files. The part of the work the client actually sees happens outside the system that runs the rest of the business.
3D Scans closes that gap. The job already holds the photos, so the job is now where they get processed, measured, annotated, and reported on. It works as a photogrammetry step built into the place the flight was planned and logged, and the results are saved back to the same job as ordinary files.
Start a Scan from the Photos You Already Uploaded
Open a job, go to the 3D Scans tab, and press Start 3D scan. Give the scan a name and choose what you want out of it:
Map and measurements builds a detailed top-down map of the site, along with height and slope information, so you can measure roofs, sites, and volumes. It is the fastest option.
3D model and map includes everything above and adds a textured model you can view from any angle.
Thermal map builds a temperature map from the thermal photos of DJI thermal cameras, for roofs, solar panels, and buildings.
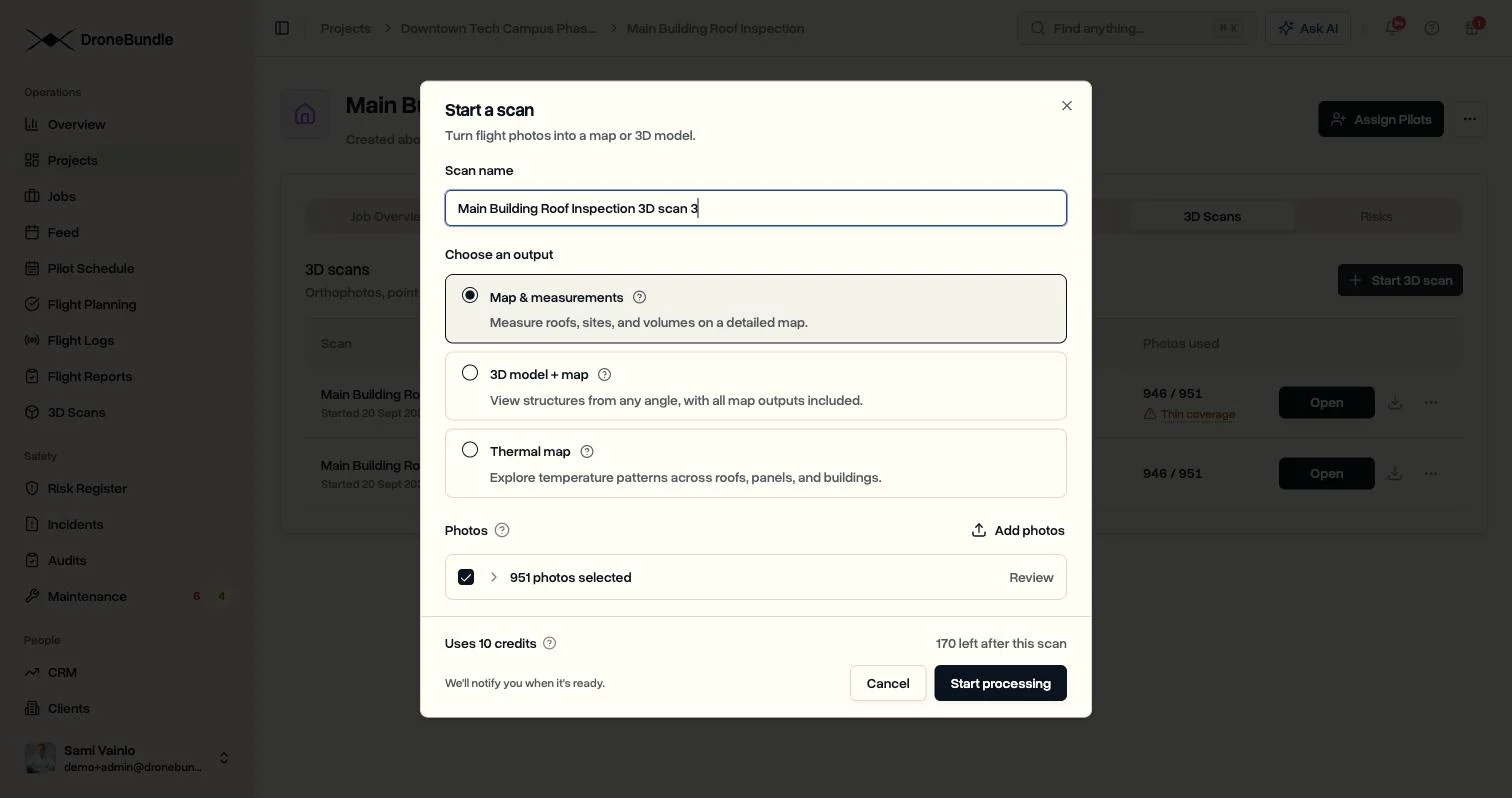
Every photo on the job is selected by default. You can review them, leave out a group or single photos, or add more without closing the window. If the flight was uploaded as zip archives, DroneBundle offers to unpack them into the job first and then starts the scan on its own. Identical photos uploaded twice are only counted once.
A scan takes between 10 and 1,500 photos. A small thermal set can be ready in minutes, and a building flown with a thousand photos takes a few hours. You do not have to wait on the page. A notification tells you when the scan is ready, or why it failed, and up to five scans can run at the same time in one workspace.
Photos that cannot be used are set aside rather than stopping the whole run. A phone photo with no location, or a stray frame taken kilometres away, is skipped and listed afterwards so you know exactly what went in.
A Map Sharp Enough to Inspect
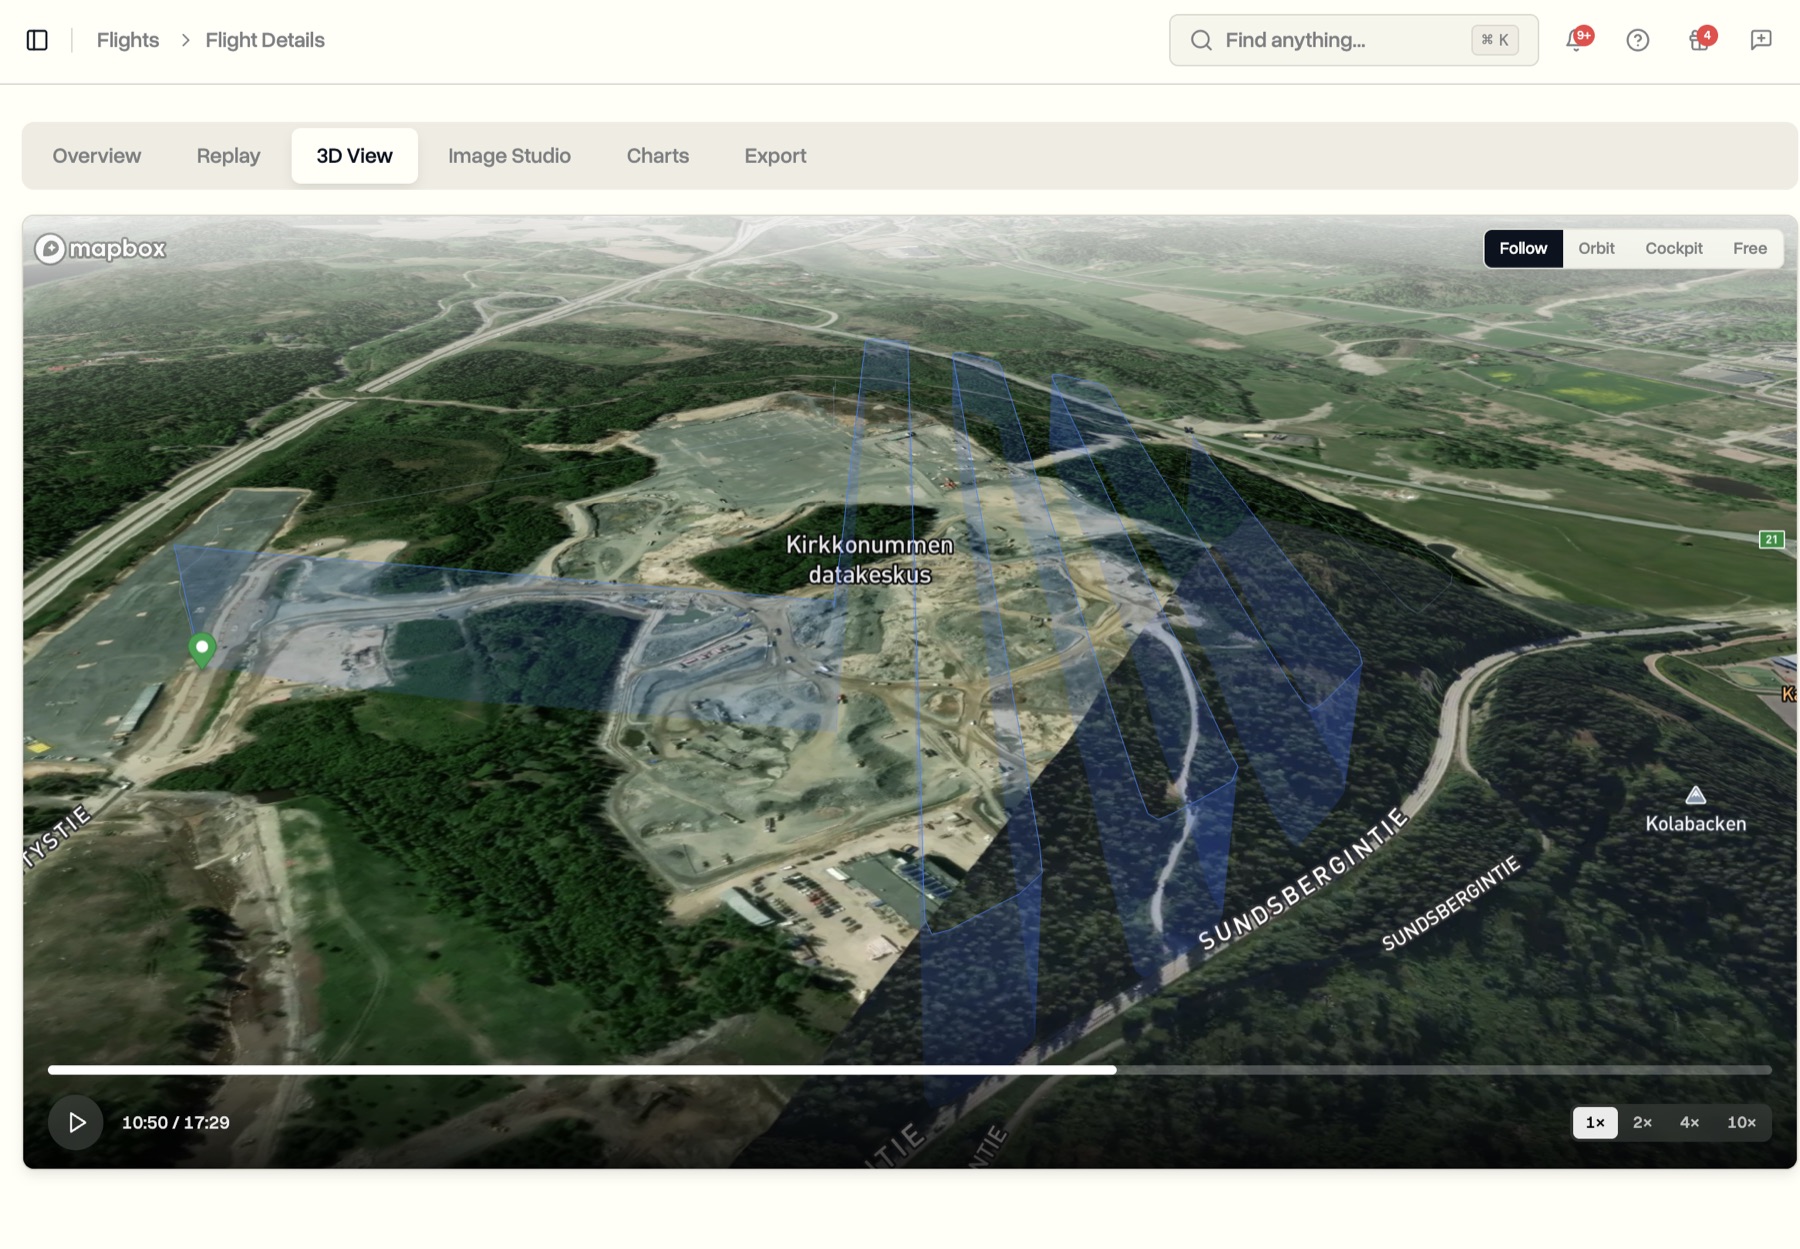
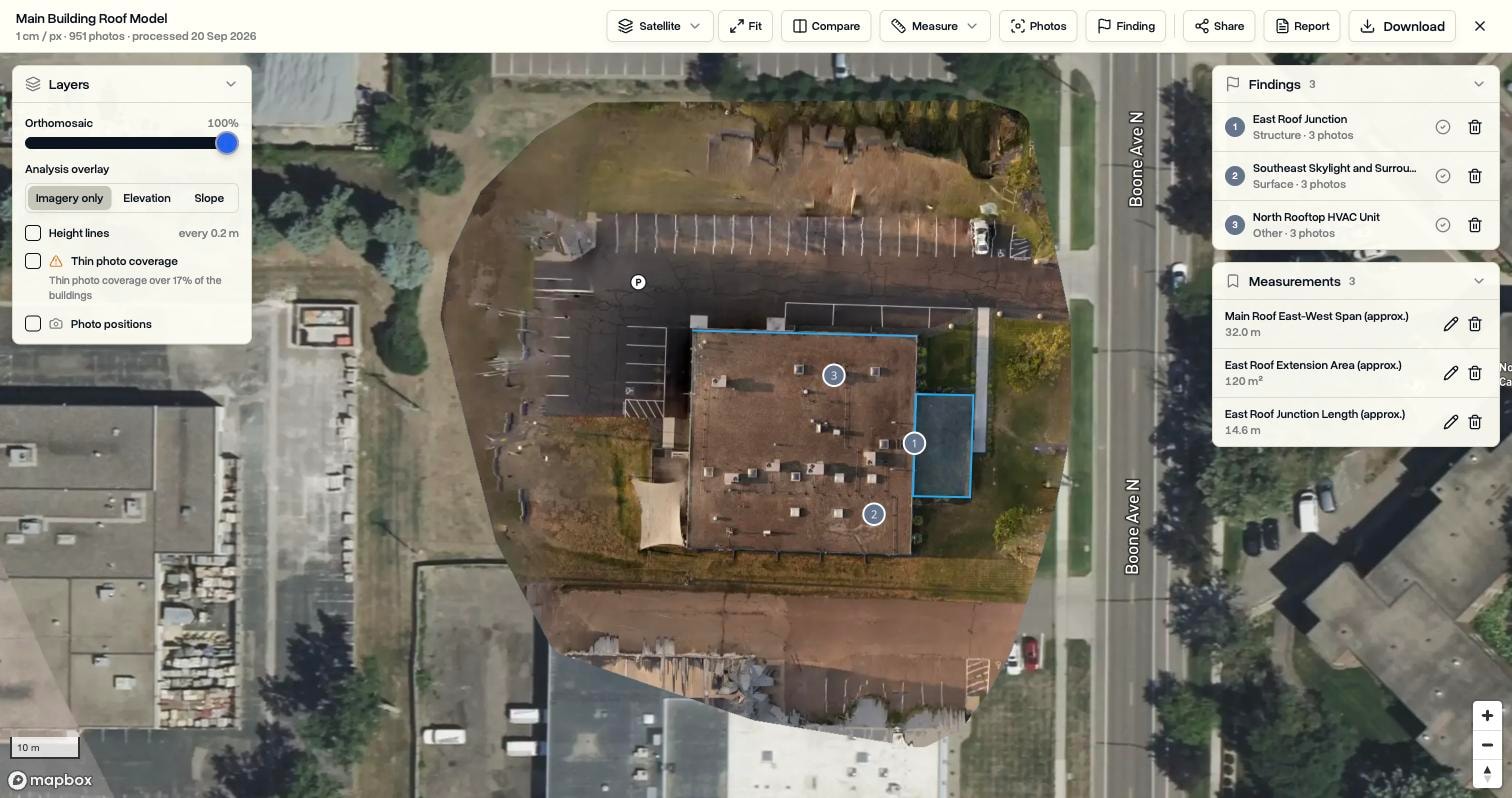
A ready scan opens full screen. The processed map sits on top of satellite imagery, so you see the site in its surroundings, and an opacity slider lets you fade between the two.
The detail is the point. Scans are processed at the finest resolution the photos allow, which for a typical roof flight is around one centimetre per pixel. Zoom in and you can read the roof surface: seams, drains, vents, fixings, the edge of a membrane. That is the difference between an orthomosaic that looks good in a slide and one you can inspect from.
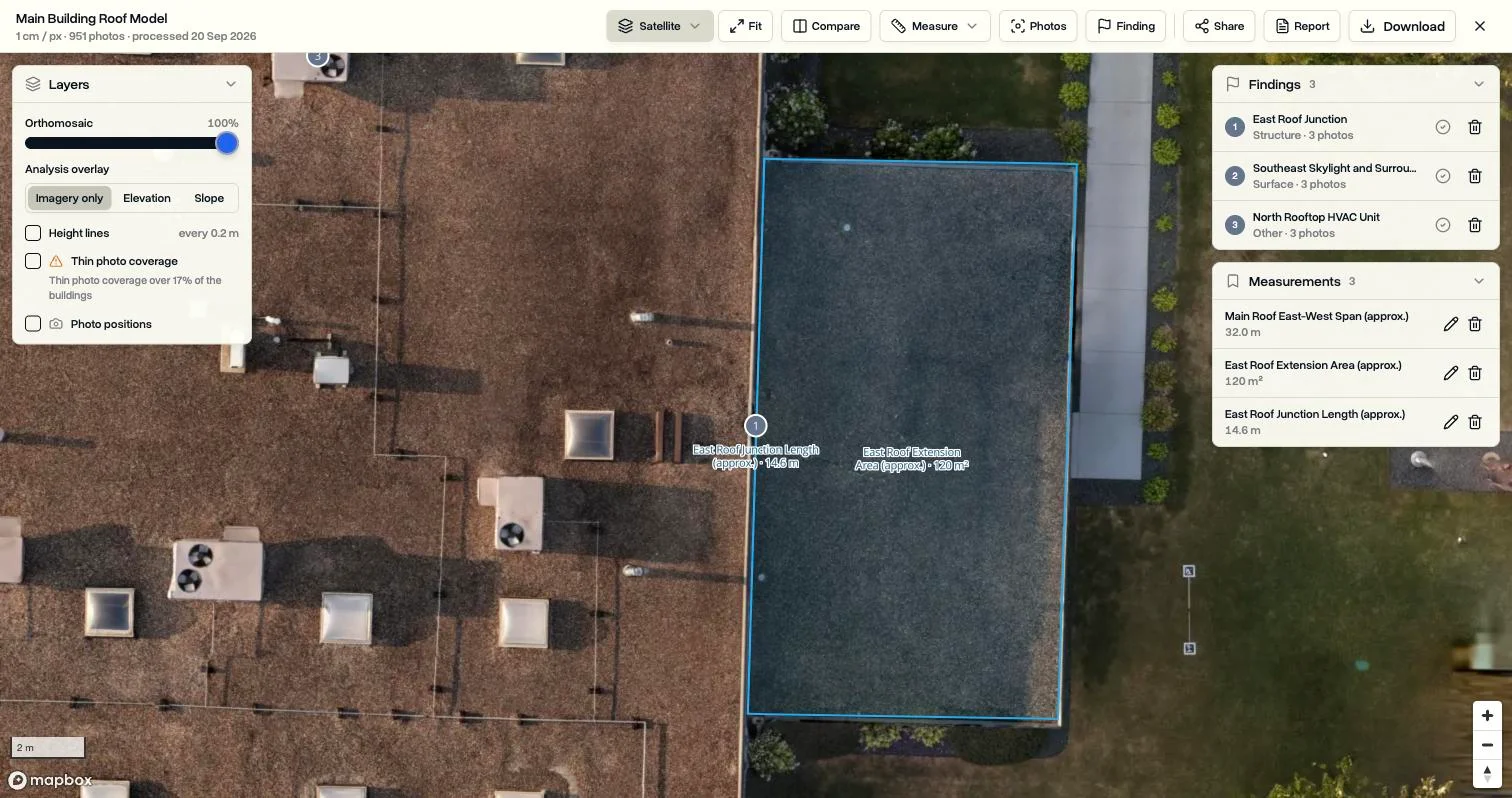
Switch the overlay to Elevation and the map is coloured by height, with the scan's lowest and highest points on the legend. Slope shows where surfaces are flat and where they fall away, and height lines can be drawn on top. Photo positions shows where every photo was taken, so you can see how the site was flown.
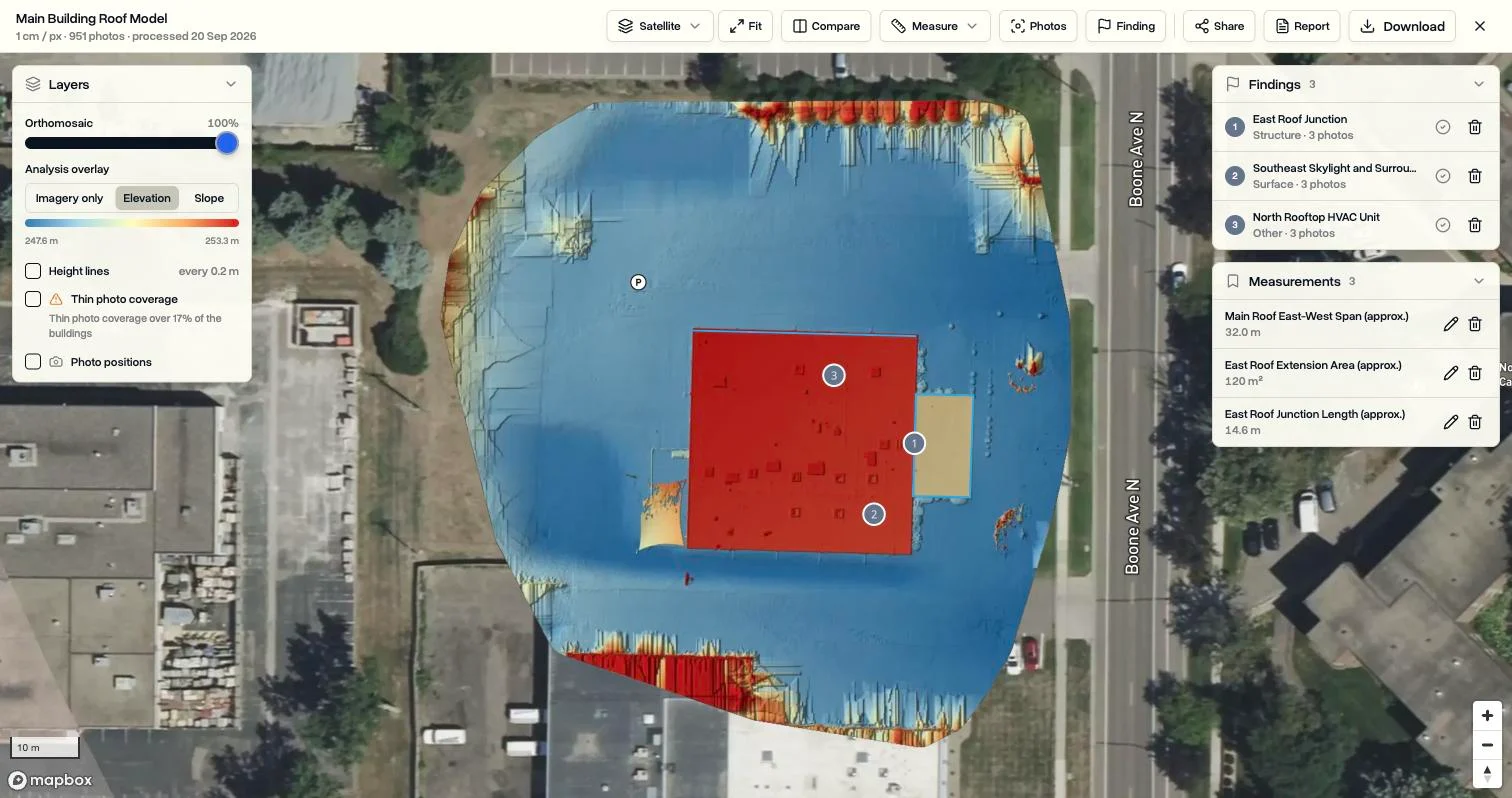
If part of a building was only caught by a handful of photos, the scan says so. Those areas are marked as thin photo coverage, on the scan list and on the map, so nobody measures from a surface that may be incomplete, and the pilot knows what to fly again.
Measure Distance, Area, Height, Pitch, and Volume
The Measure menu has six tools. Distance and Area work the way you expect. Height reads the elevation of any point. Profile draws a line across the site and charts the height along it, which shows a parapet, a step between roof levels, or the fall of a yard at a glance. Roof traces one roof face and returns its pitch, the direction it faces, and its true surface area rather than only its footprint. Volume measures a stockpile or an excavation against the ground around it.
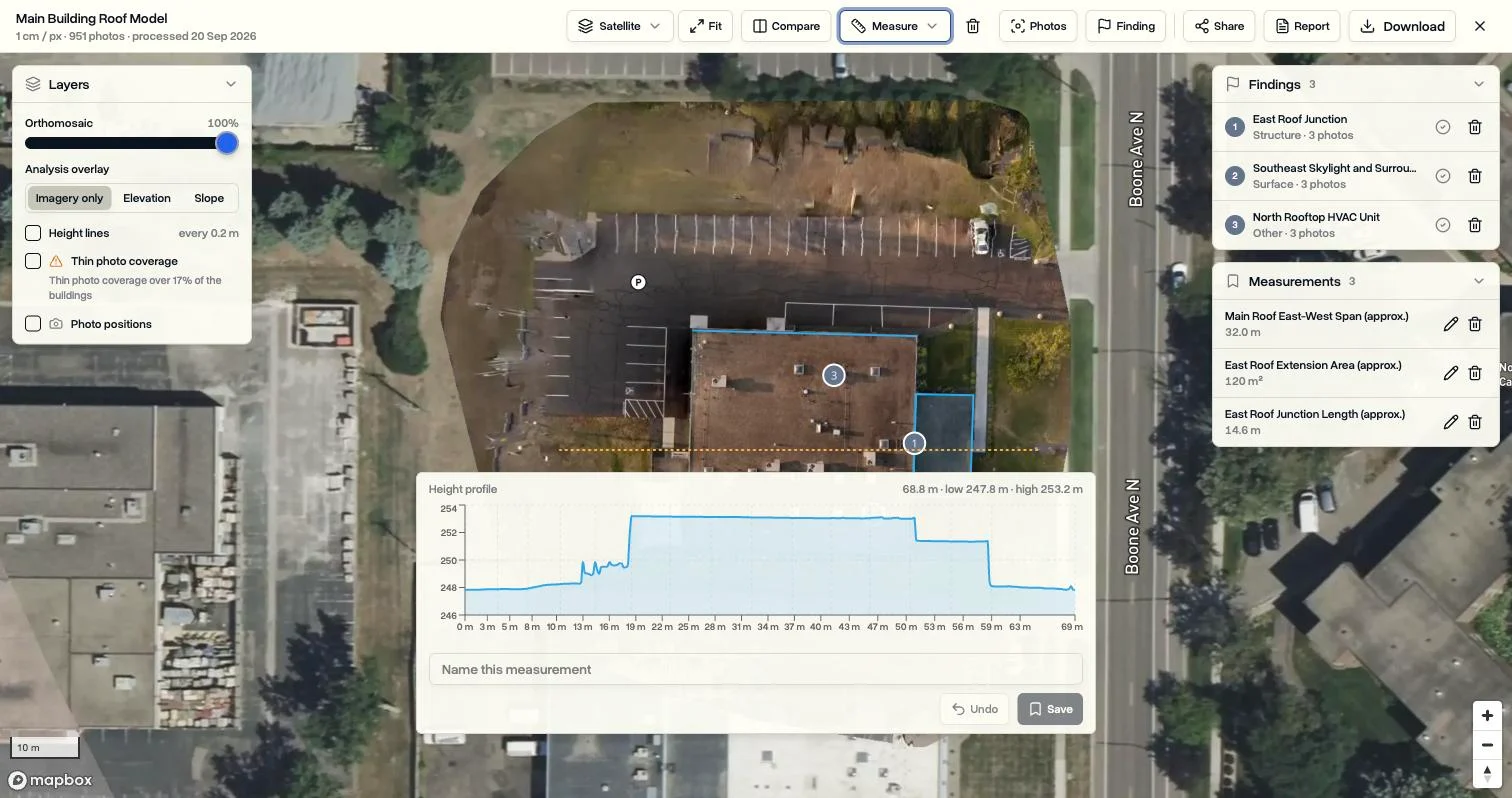
Any measurement can be saved with a name. Saved measurements stay on the map for everyone who opens the scan, appear in the report, and can be adjusted later by moving their points. Every figure follows your workspace's unit setting, so a team working in feet and square feet sees feet and square feet.
See Every Photo That Captured a Spot
A stitched map is a summary. When something on it looks wrong, the evidence is in the original photos, and finding the right ones among a thousand files used to mean scrolling through thumbnails.
Choose Photos and click anywhere on the map. DroneBundle lists every original photo that captured that exact spot, the most direct view first, each with a ring drawn around the spot itself. Open one full screen and step through the rest with the arrow keys.
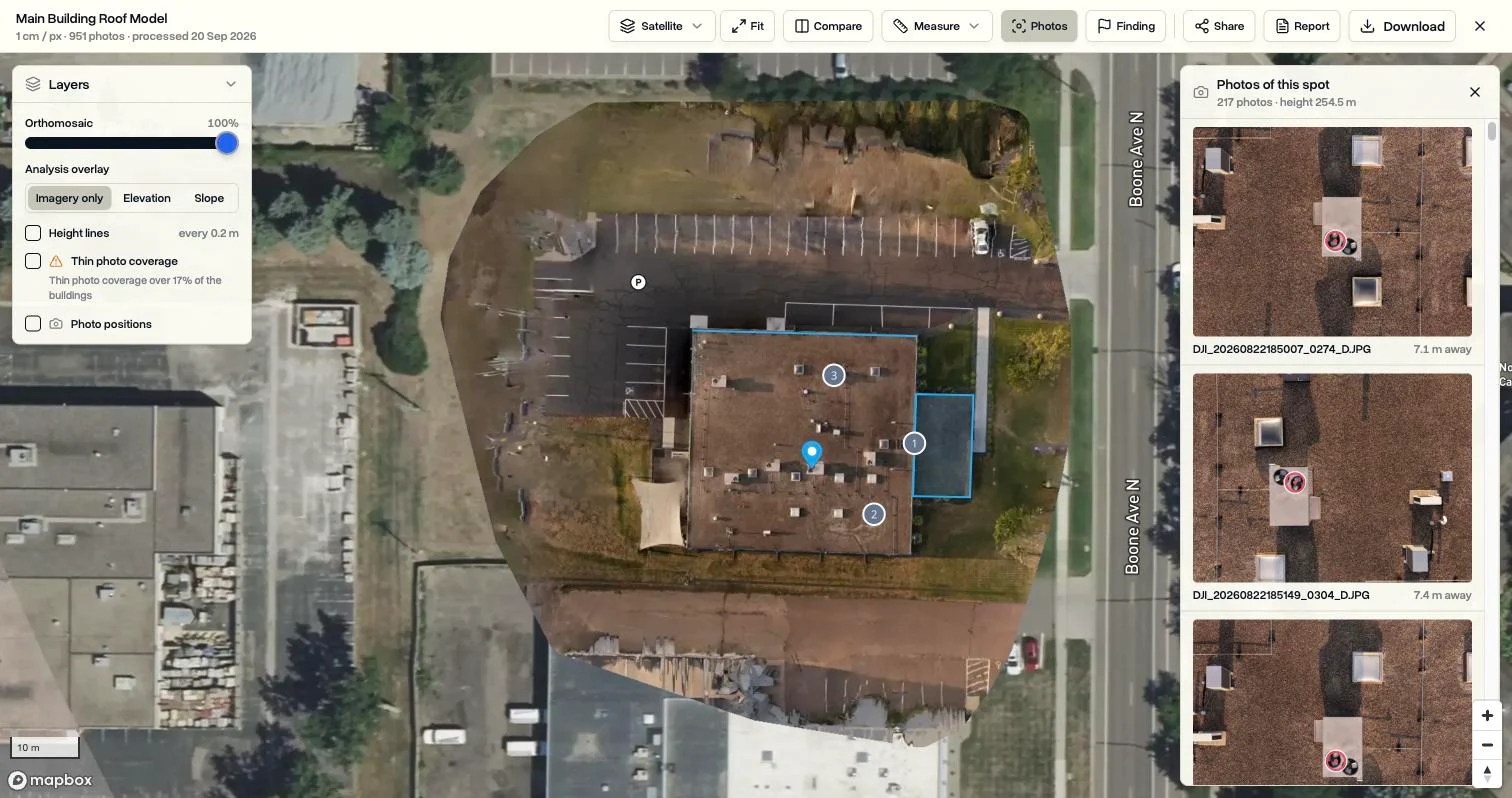
For example, if a dark patch next to a rooftop unit could be standing water or could be a shadow, you click it and look at it from the dozen angles the drone actually saw it from.
Mark Findings with a Condition, a Status, and a Cost
Findings turn the map into an inspection. Pin a spot or outline an area, give it a title and a category, rate its condition, and add a note. The best photos of that spot are attached automatically. Each finding keeps its location, and an outlined area keeps its size. You can mark a finding open or resolved and put an estimated cost of repair on it, and the list on the right totals the costs.
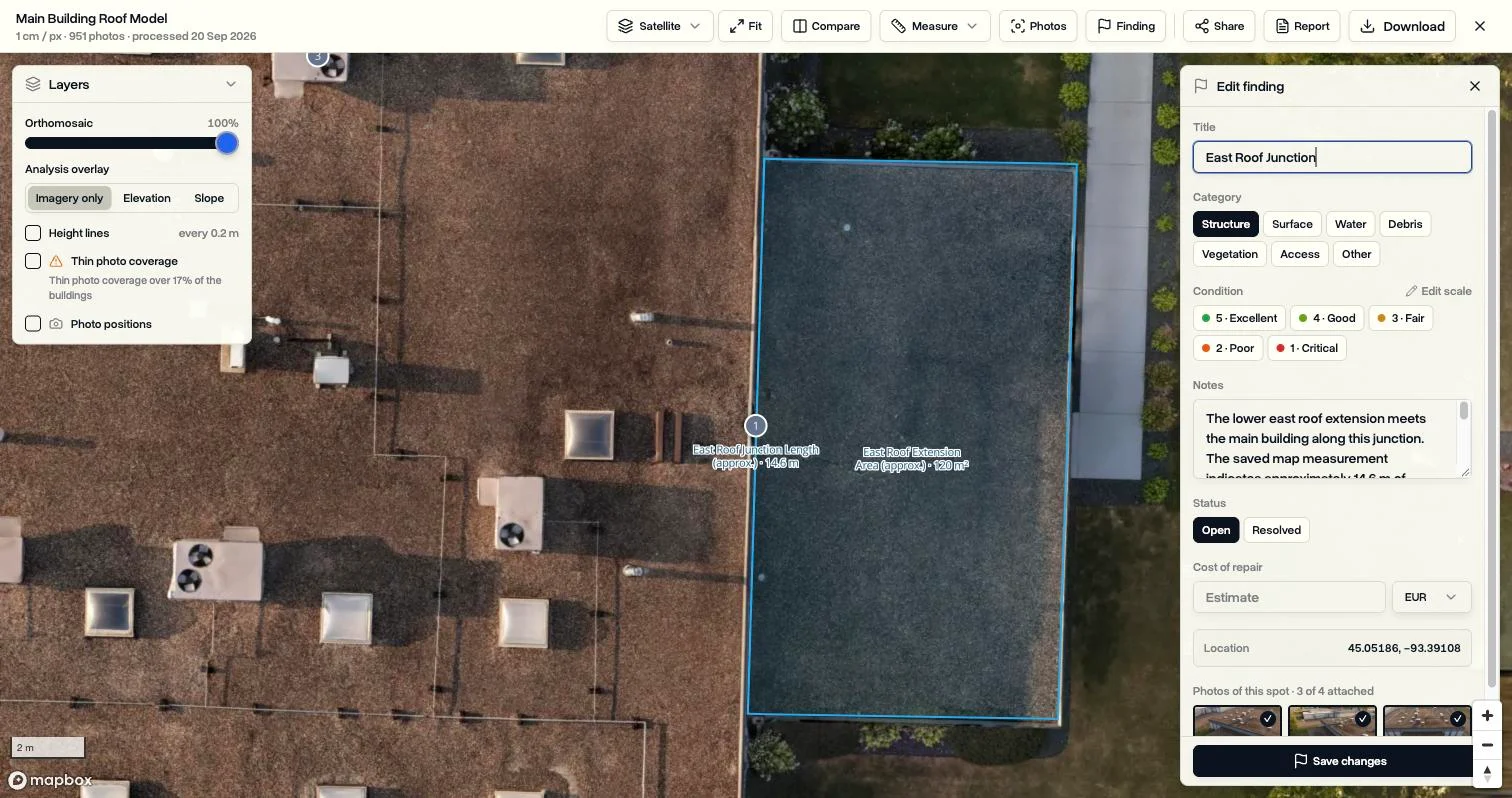
The categories and the condition scale are yours to define. A workspace can keep its own rating templates, so if that is how your team runs, a roofing crew and a solar crew can each rate against their own scale. Changing a template later never rewrites findings that were already made.
On a thermal scan, a pinned finding records the temperature at that spot, and an outlined area records its average, lowest, and highest temperature and how much warmer or cooler it is than its surroundings.
Thermal Maps, Paired with the Visible Picture
A thermal scan reads the real temperatures out of the photos rather than stitching the coloured pictures together. The temperature under your cursor is shown live as you move across the map. You can change the colour palette, narrow the range to bring out small differences, and highlight everything above a temperature you choose. Save the view and the scan opens that way for everyone, including the client.
If the same site has both a thermal scan and a regular one, DroneBundle pairs them. One switch flips between the two, findings made on either appear on both, and the report can show the thermal and visible crops of each finding side by side. For timing the flight and reading the results, our guide to thermal drone work covers the basics.
Send a Report or a Link
The Report editor builds a client-facing PDF from the scan. Write an overview and recommendations, choose which findings and measurements go in and in what order, and pick the sections to include: a condition summary, a findings table, a page per finding with its photos, and the saved measurements. A live preview shows the pages as you go. Notes and captions edited here only change the report, not the scan.
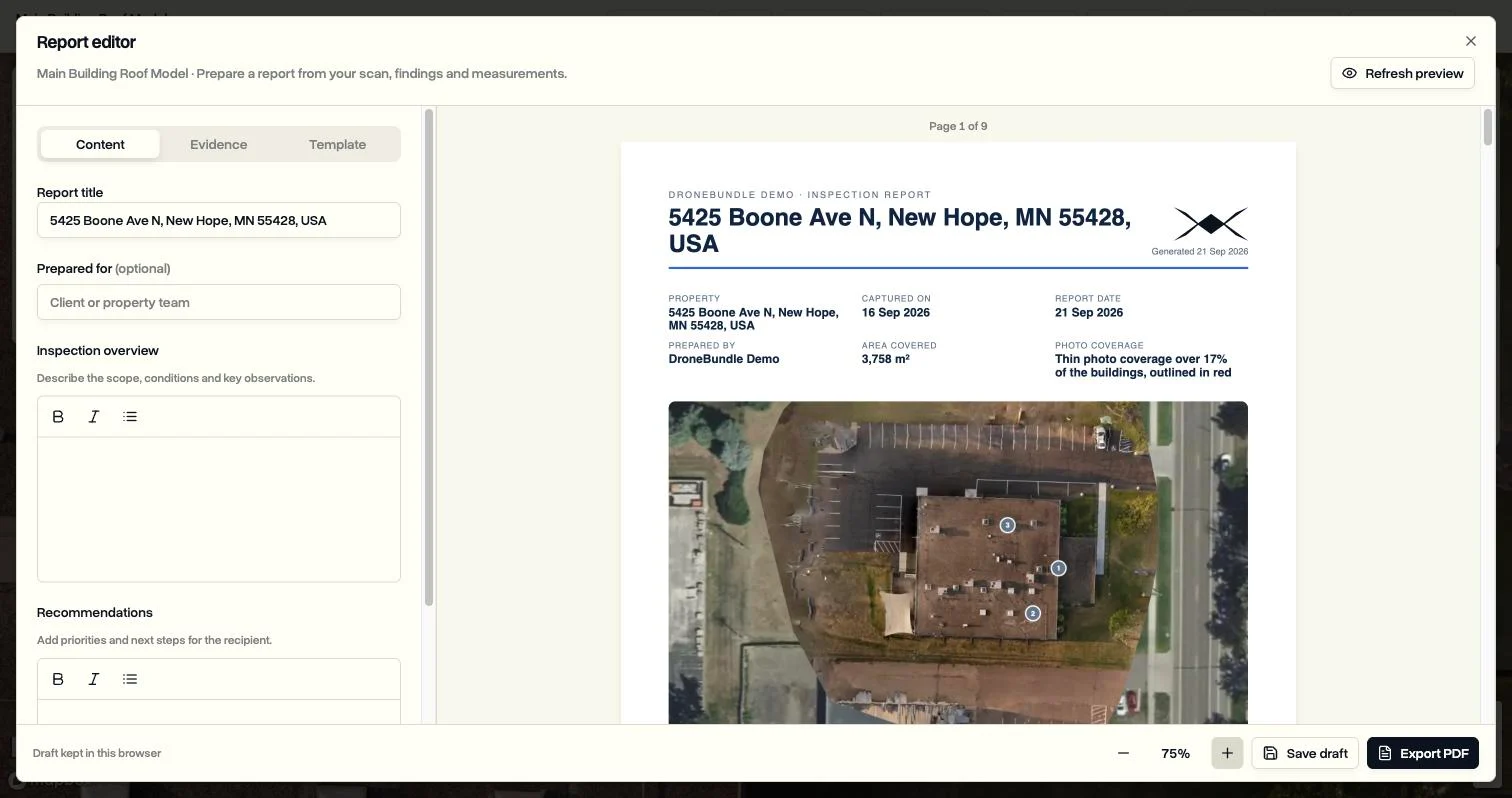
The cover takes the property address as its title, found automatically from where the scan is. If your workspace uses custom branding, the report carries your logo and company name and does not mention DroneBundle. A layout can be saved as a template and reused on the next job.
When a PDF is not enough, Share creates a public link. The client opens the scan in a browser without signing in: the map, the layers, the 3D model, your findings and measurements. You decide whether the link allows file downloads, and removing the link closes it immediately. Clients who already use the client portal can open scans on the projects they have access to.
Compare Two Scans of the Same Site
When a job has more than one scan, Compare puts two of them on the same map with a divider you drag from side to side. Both stay lined up as you pan and zoom. It is built for before and after, and for progress on a site that is flown again and again.
The Files Are Yours
Everything a scan produces is saved to the job as regular files: the full-resolution map, the point cloud, the surface and terrain models, the textured 3D model, and a processing report. They come in the standard formats other mapping and survey tools open, and anyone who can open the scan can download them.
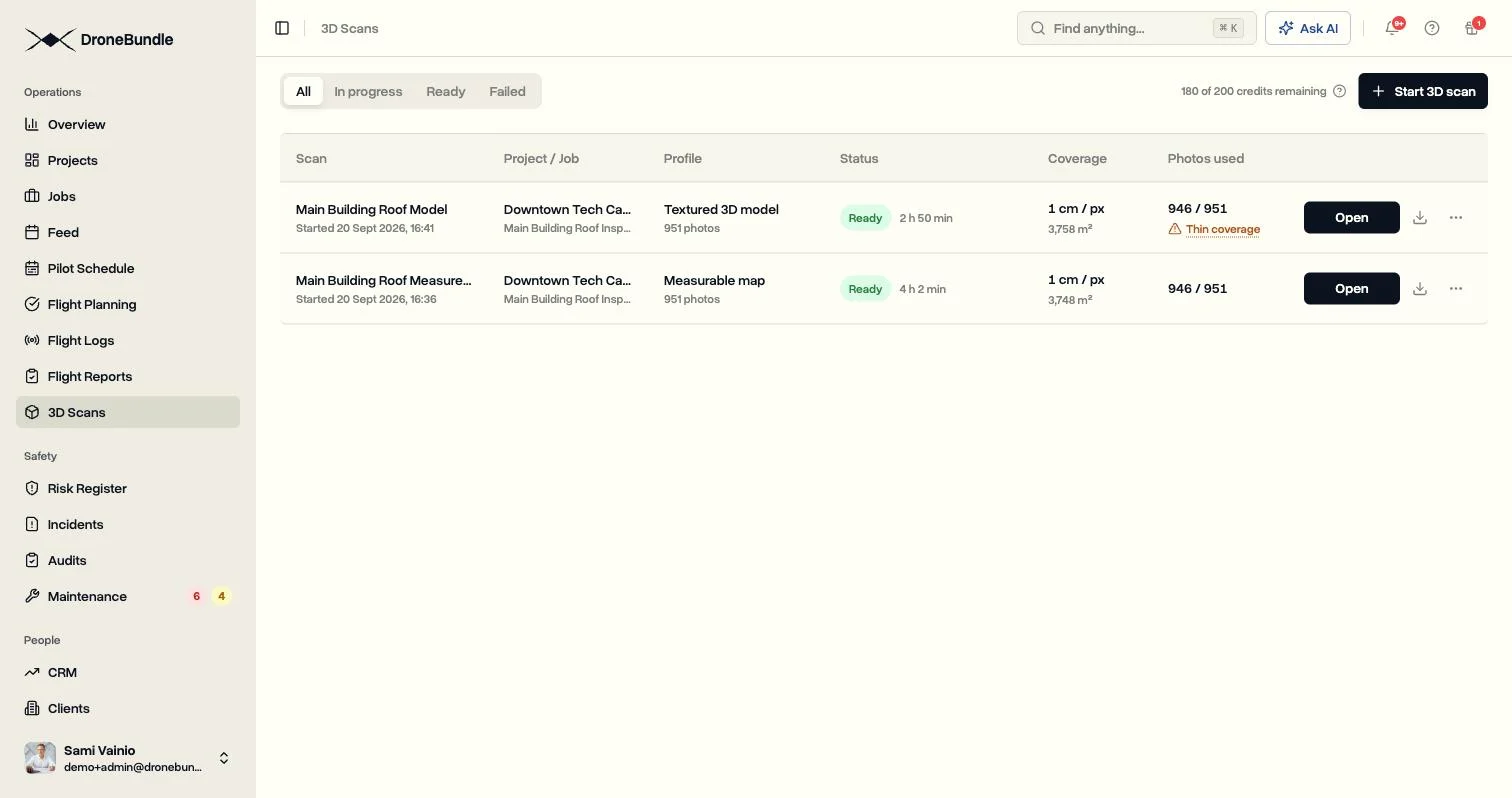
Because they are job files, they count toward your storage like any other upload, and if you use Data Ownership they are copied to your own cloud storage along with everything else. The 3D Scans page in the sidebar lists every scan in the workspace, with its status, resolution, area covered, and how many of the photos were used.
Use Cases
Roof inspections. Fly the roof, scan it, trace the faces for area and pitch, pin what needs attention with a condition and a repair estimate, and send the report. The whole roof inspection stays on one job.
Thermal surveys. Pair a thermal scan with the visible one, highlight everything above a threshold, outline the warm areas, and let the report show both views of each.
Site progress. Scan the same site on each visit and use Compare to show the client what changed since the last one.
Stockpiles and earthworks. Measure volumes on the map, save them by name, and export them in the report.
Availability
3D Scans is switched on for every workspace on the Enterprise plan and for every free trial. There is nothing to request and nothing to set up. The 3D Scans tab is on every job, and the 3D Scans page is in the sidebar.
Processing runs on monthly credits rather than a fee per scan. One credit covers up to 100 photos, so a 951-photo building uses 10. Enterprise workspaces get 200 credits a month and trials get 20, and the scan window shows what a scan will use before you start it. A scan that fails or is cancelled before it starts gives its credits back.
Workspace owners and project managers can start scans, save measurements, record findings, build reports, and create share links. Operations leads, pilots, and clients with access to the project's files can open scans, look around, and download the results.
Start your free trial to upload a flight and turn it into a map you can measure.
Book a demo to see how DroneBundle takes drone photos from the job to a finished client report.