Open any flight and see the whole story. Replay it on the map, fly it again in 3D, read every reading as a chart, turn the path into a shareable image, and export a clean report for the file. One flight, six ways to look at it.
A flight log starts life as a wall of numbers. The aircraft records its height, speed, heading, battery, satellites, and a dozen other things several times a second, from the moment it lifts off to the moment it sets back down. By the end of a routine flight that is tens of thousands of readings. All of it is useful, and almost none of it is legible in that raw shape.
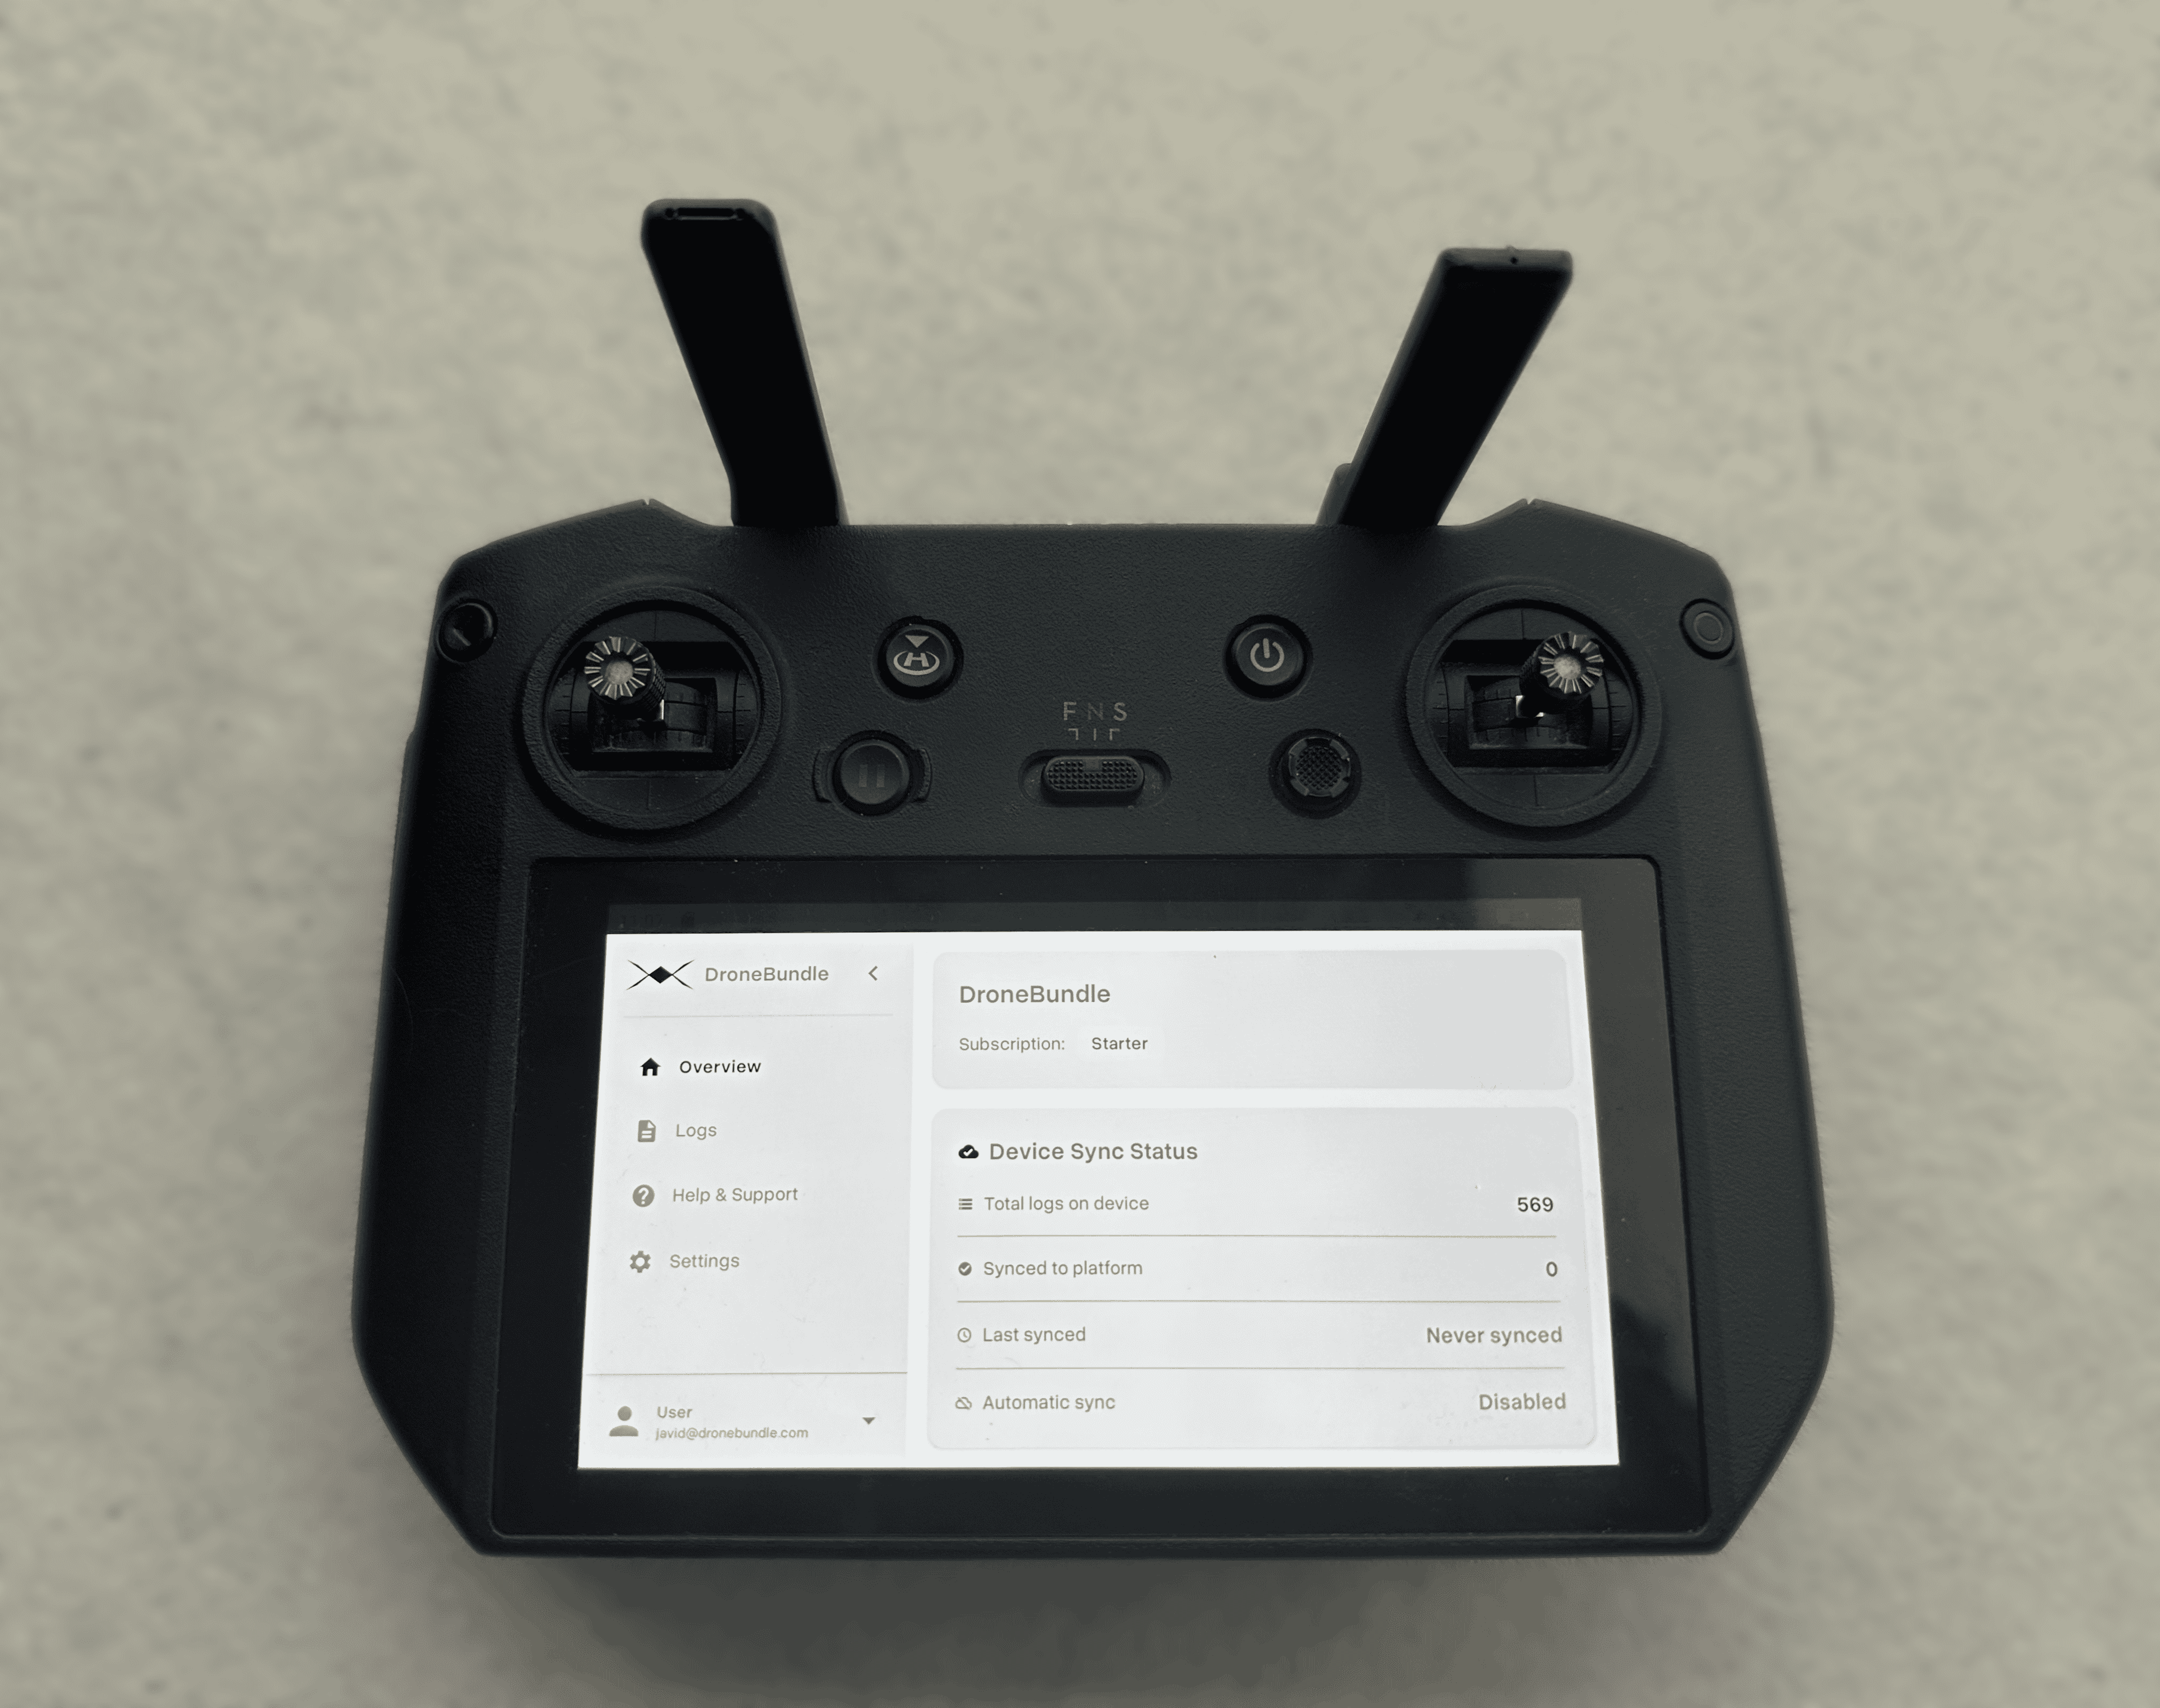
Getting those logs into DroneBundle is already handled: upload them, or let the Android sync app pull them off the controller after every flight. The question this update answers is what happens once they are in. We rebuilt the flight page from the ground up so a log stops being an archive you hope you never need, and becomes something you actually open: to settle a question, to brief a client, to check that a flight went the way it should have.
Every flight now opens into six tabs across the top: Overview, Replay, 3D View, Image Studio, Charts, and Export. Each one reads the same flight, so you move between the summary, the map, the charts, and the report without leaving the page. Every measurement follows your workspace's unit setting, so a team that works in feet and miles per hour never has to convert in their head.
Overview: The Whole Flight at a Glance
The Overview is the first thing you see, and most days it is the only tab you need. It puts the flight details, the path on a map, and the headline numbers side by side: how long the flight lasted, how far it travelled, how high it went, top speed, and how the battery did from takeoff to landing.
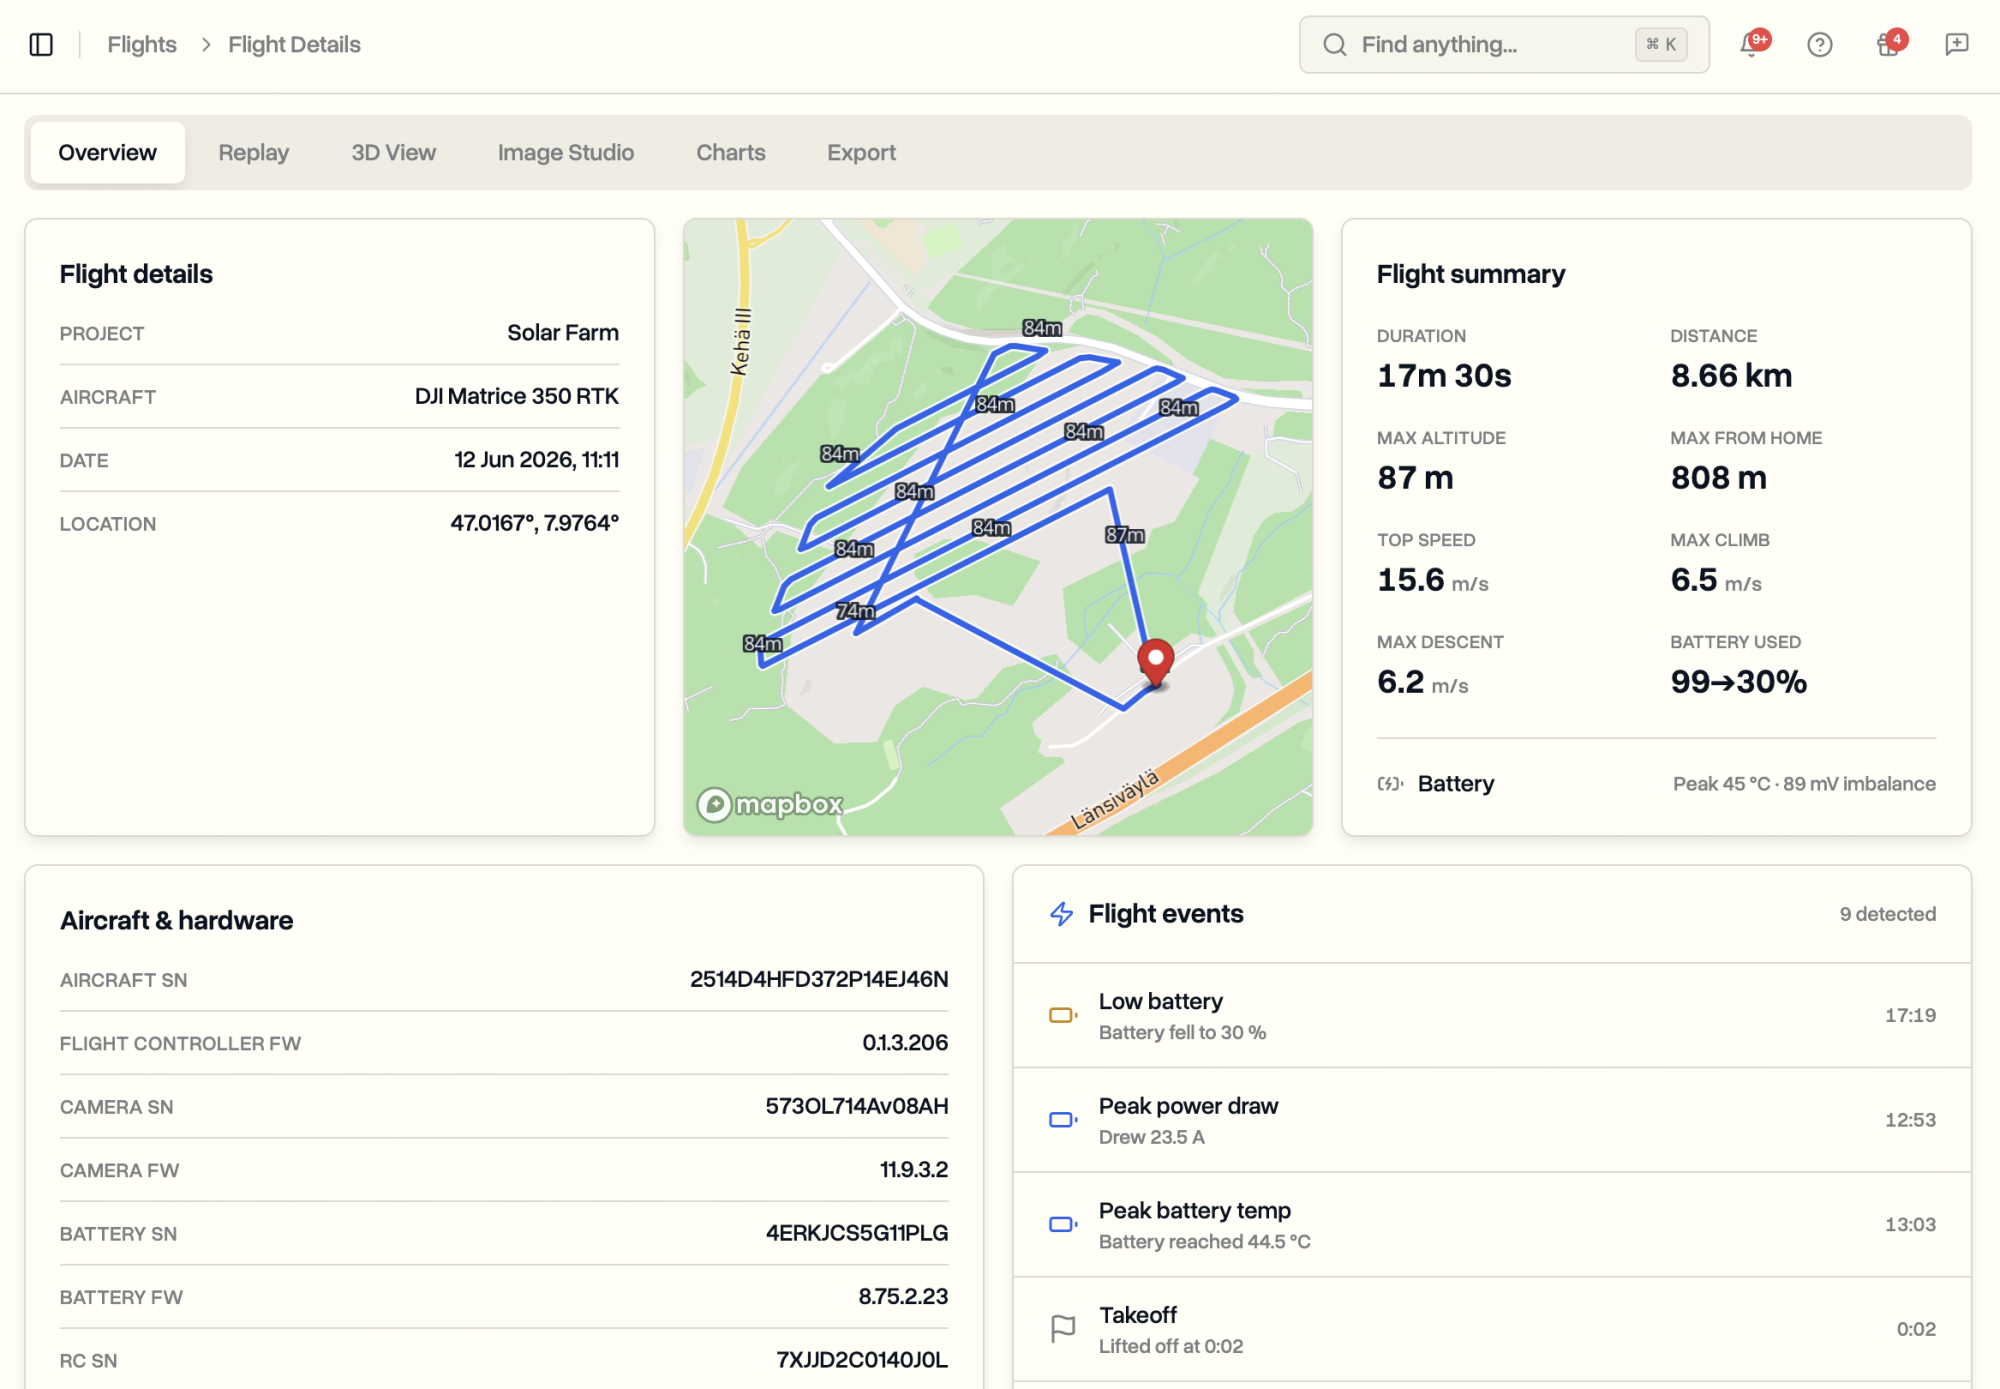
Below that sits a list of notable moments the page picks out on its own: takeoff and landing, peak height and top speed, the lowest the battery dropped, the hardest the motors pulled, and anything worth a second look such as a low-battery stretch, a height or distance limit reached, or a return-to-home. Nothing here is something you had to flag. The page reads the flight and surfaces it.
Not every flight has a path to draw. A flight indoors, or anywhere the aircraft never gets a clean satellite fix, has no usable position to map. Rather than show a broken map, the Overview says so plainly and still gives you the full summary from the flight record, so an indoor test flight is just as readable as one flown in the open.
Replay: Scrub Through the Flight Like Video
Replay turns the log back into motion. Press play and the aircraft retraces its path across the map while a live readout panel shows exactly what it was doing at that instant: height, climb and descent, ground speed, heading, battery charge, satellites, distance from the launch point, and the rest. Drag the timeline to jump to any moment, the same way you would scrub through a video.
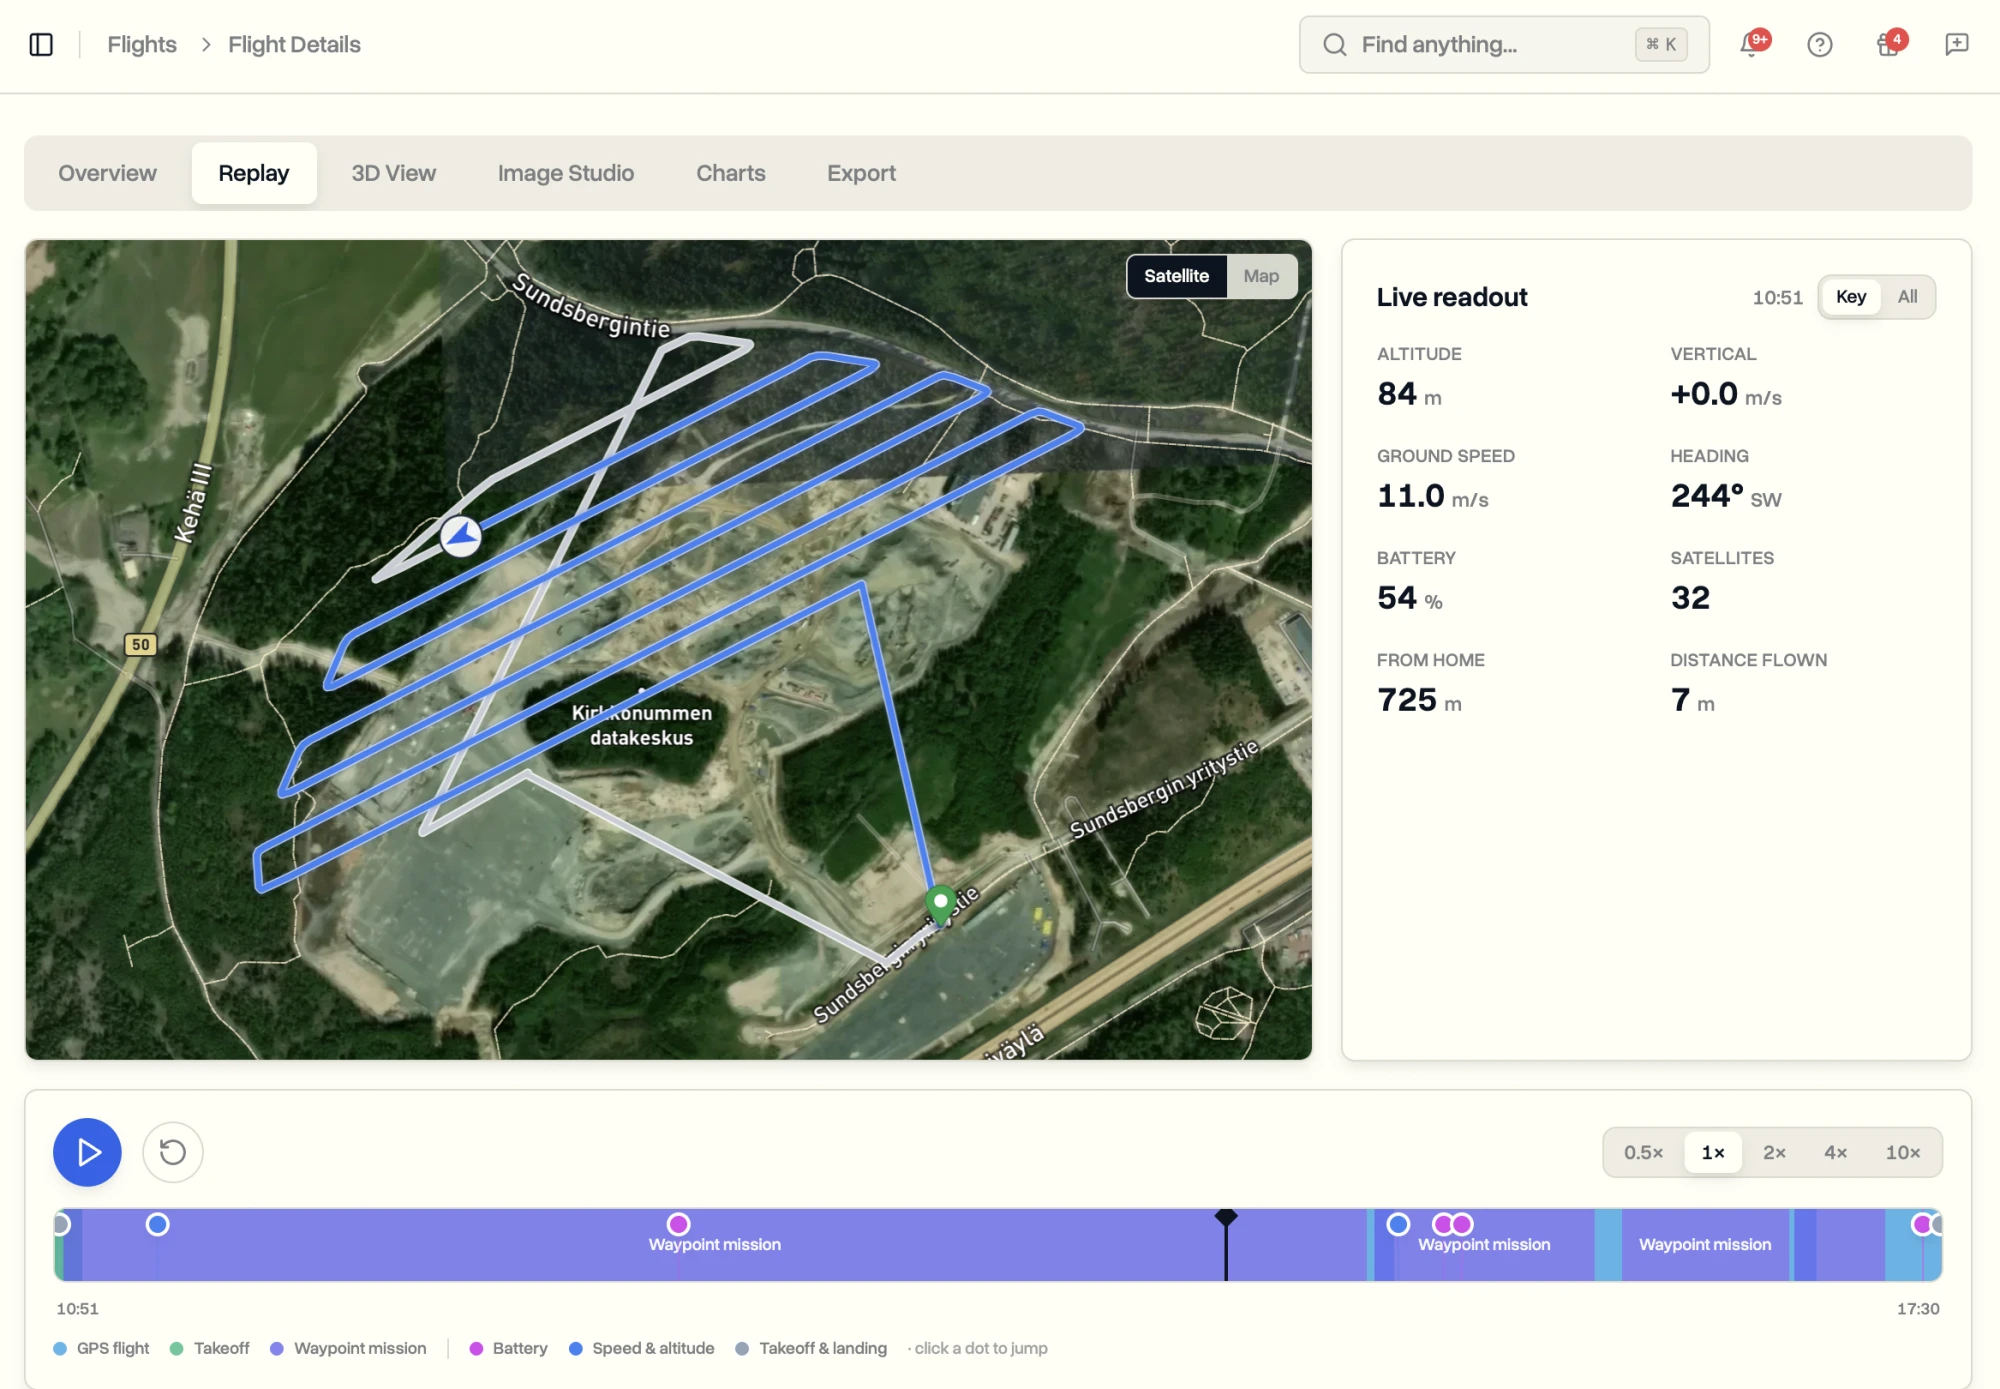
The timeline underneath is marked up with the phases of the flight and the same notable moments from the Overview, so you can jump straight to the part that matters. If a battery warning came up halfway through, click it and the whole panel snaps to that second. For example, if you want to know what the aircraft was doing when the link to the controller weakened, you scrub to that point and read it off, instead of guessing from a number in a table.
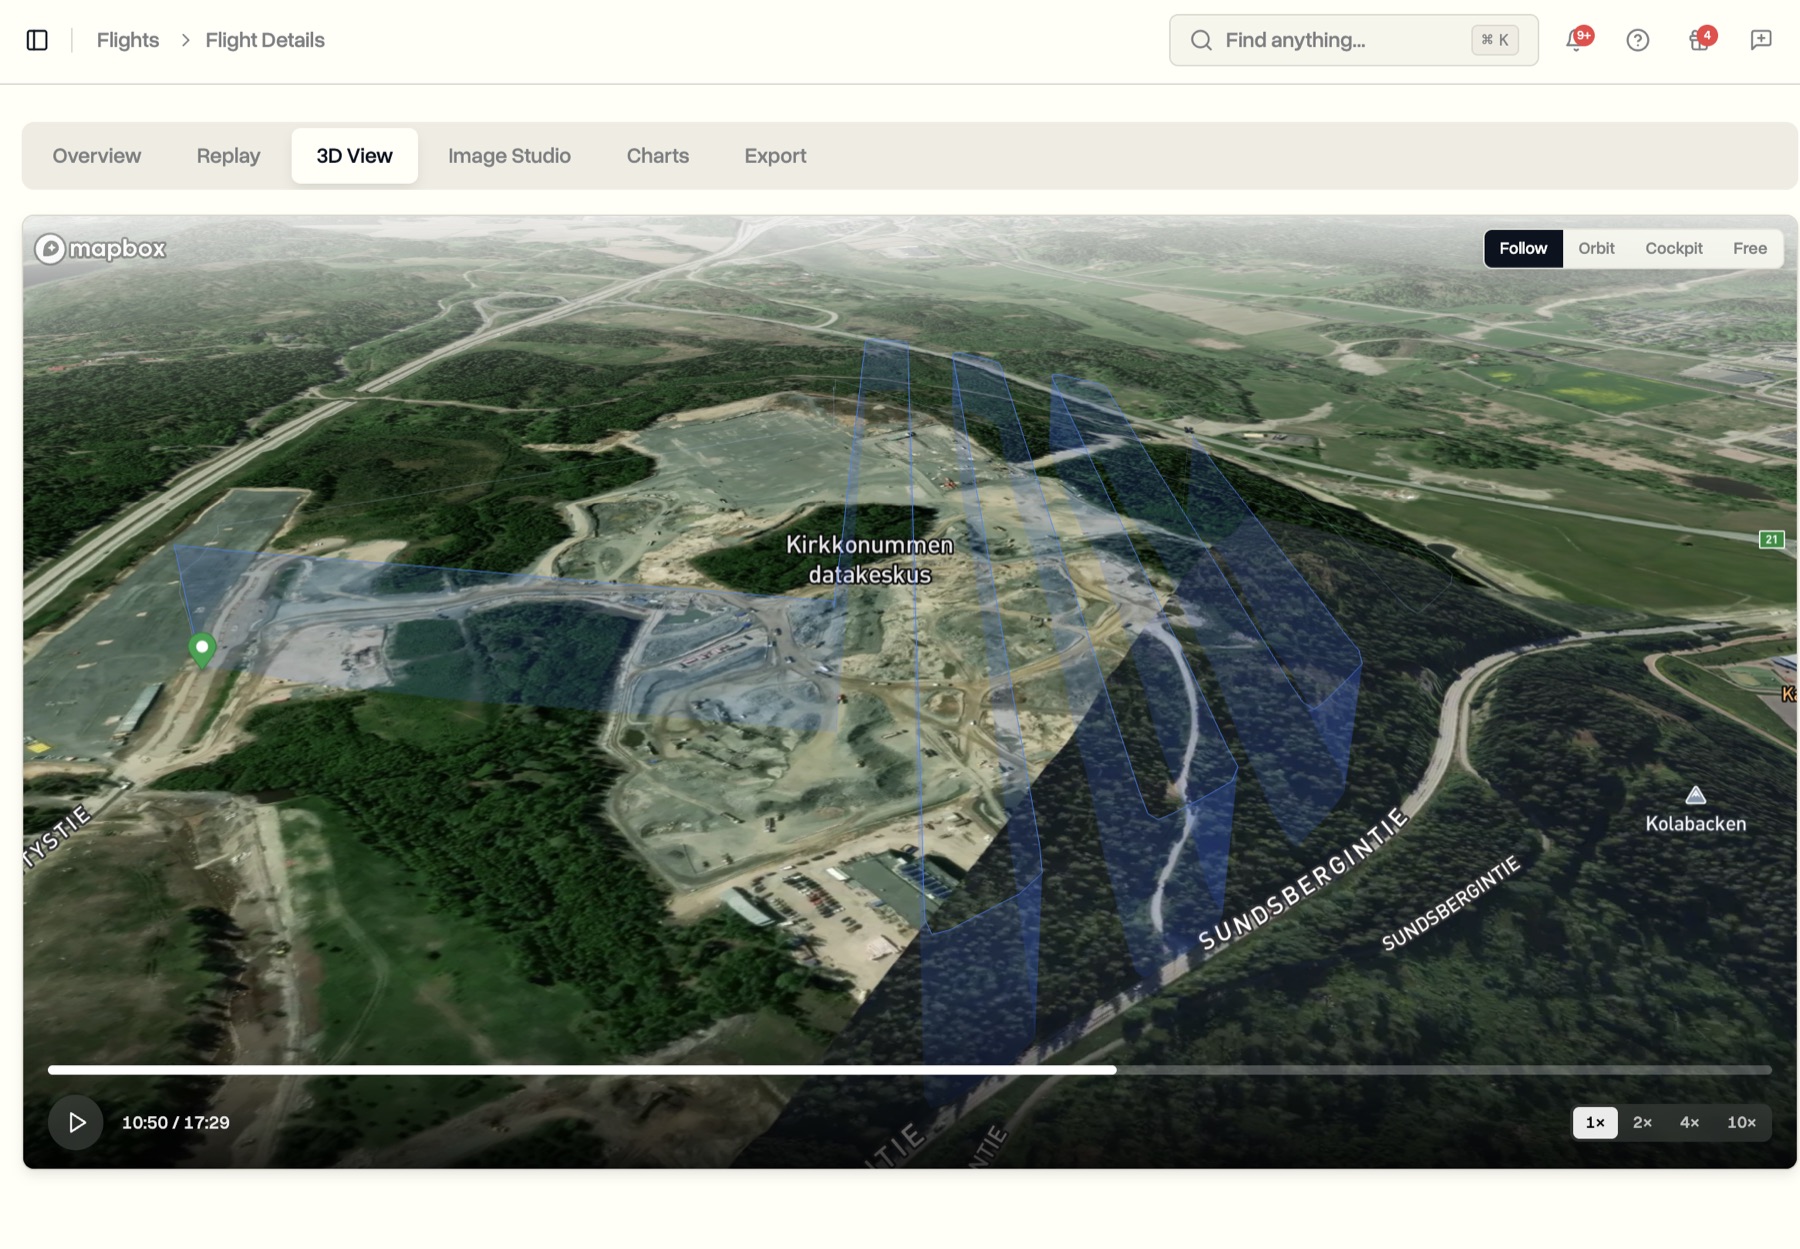
3D View: Fly the Flight Again
The 3D View is the one people stop on. The flight plays back over satellite terrain as a proper three-dimensional scene, with the path drawn in the air at the height it was actually flown and the aircraft moving along it. The camera glides and follows on its own, so the flight plays like a short cinematic clip rather than a diagram you have to spin around yourself.
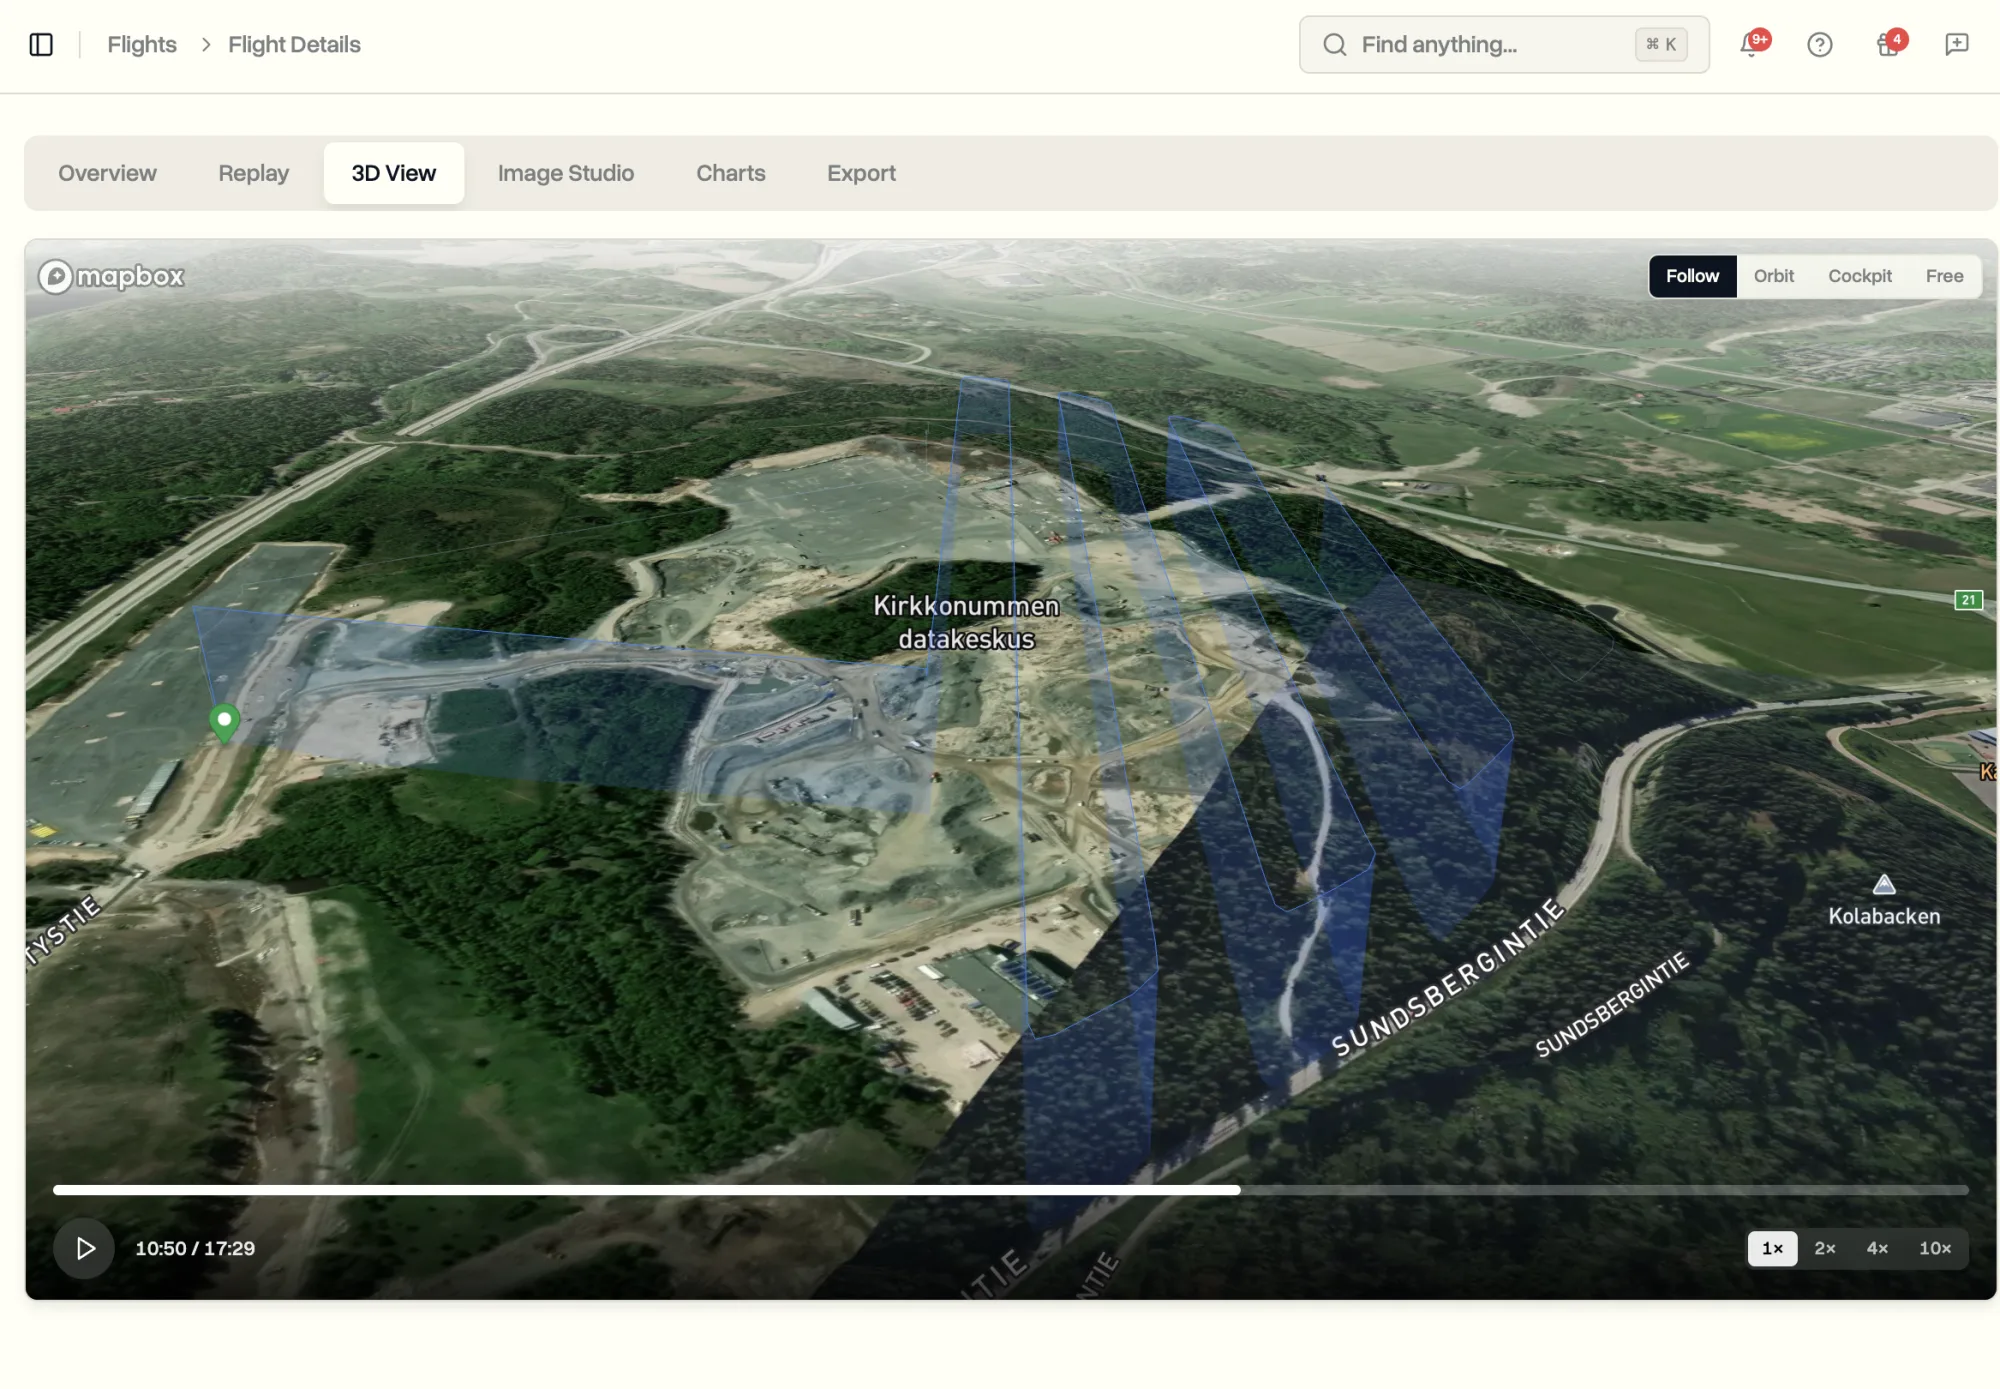
Seeing a flight in three dimensions makes things obvious that a flat map hides. How close a pass really was to a structure, how steeply the aircraft climbed out, how the height changed over a ridge or around a building. It is the closest thing to standing on site and watching the flight happen a second time.
Image Studio: Turn a Flight Path into a Shareable Picture
Image Studio makes a single, polished image of the flight path, the kind of thing you would put in a report, a proposal, or a post. Pick a shape to suit where it is going, from a square for social to a wide landscape for a document, choose a map style and a path colour, and the image renders live as you adjust it.
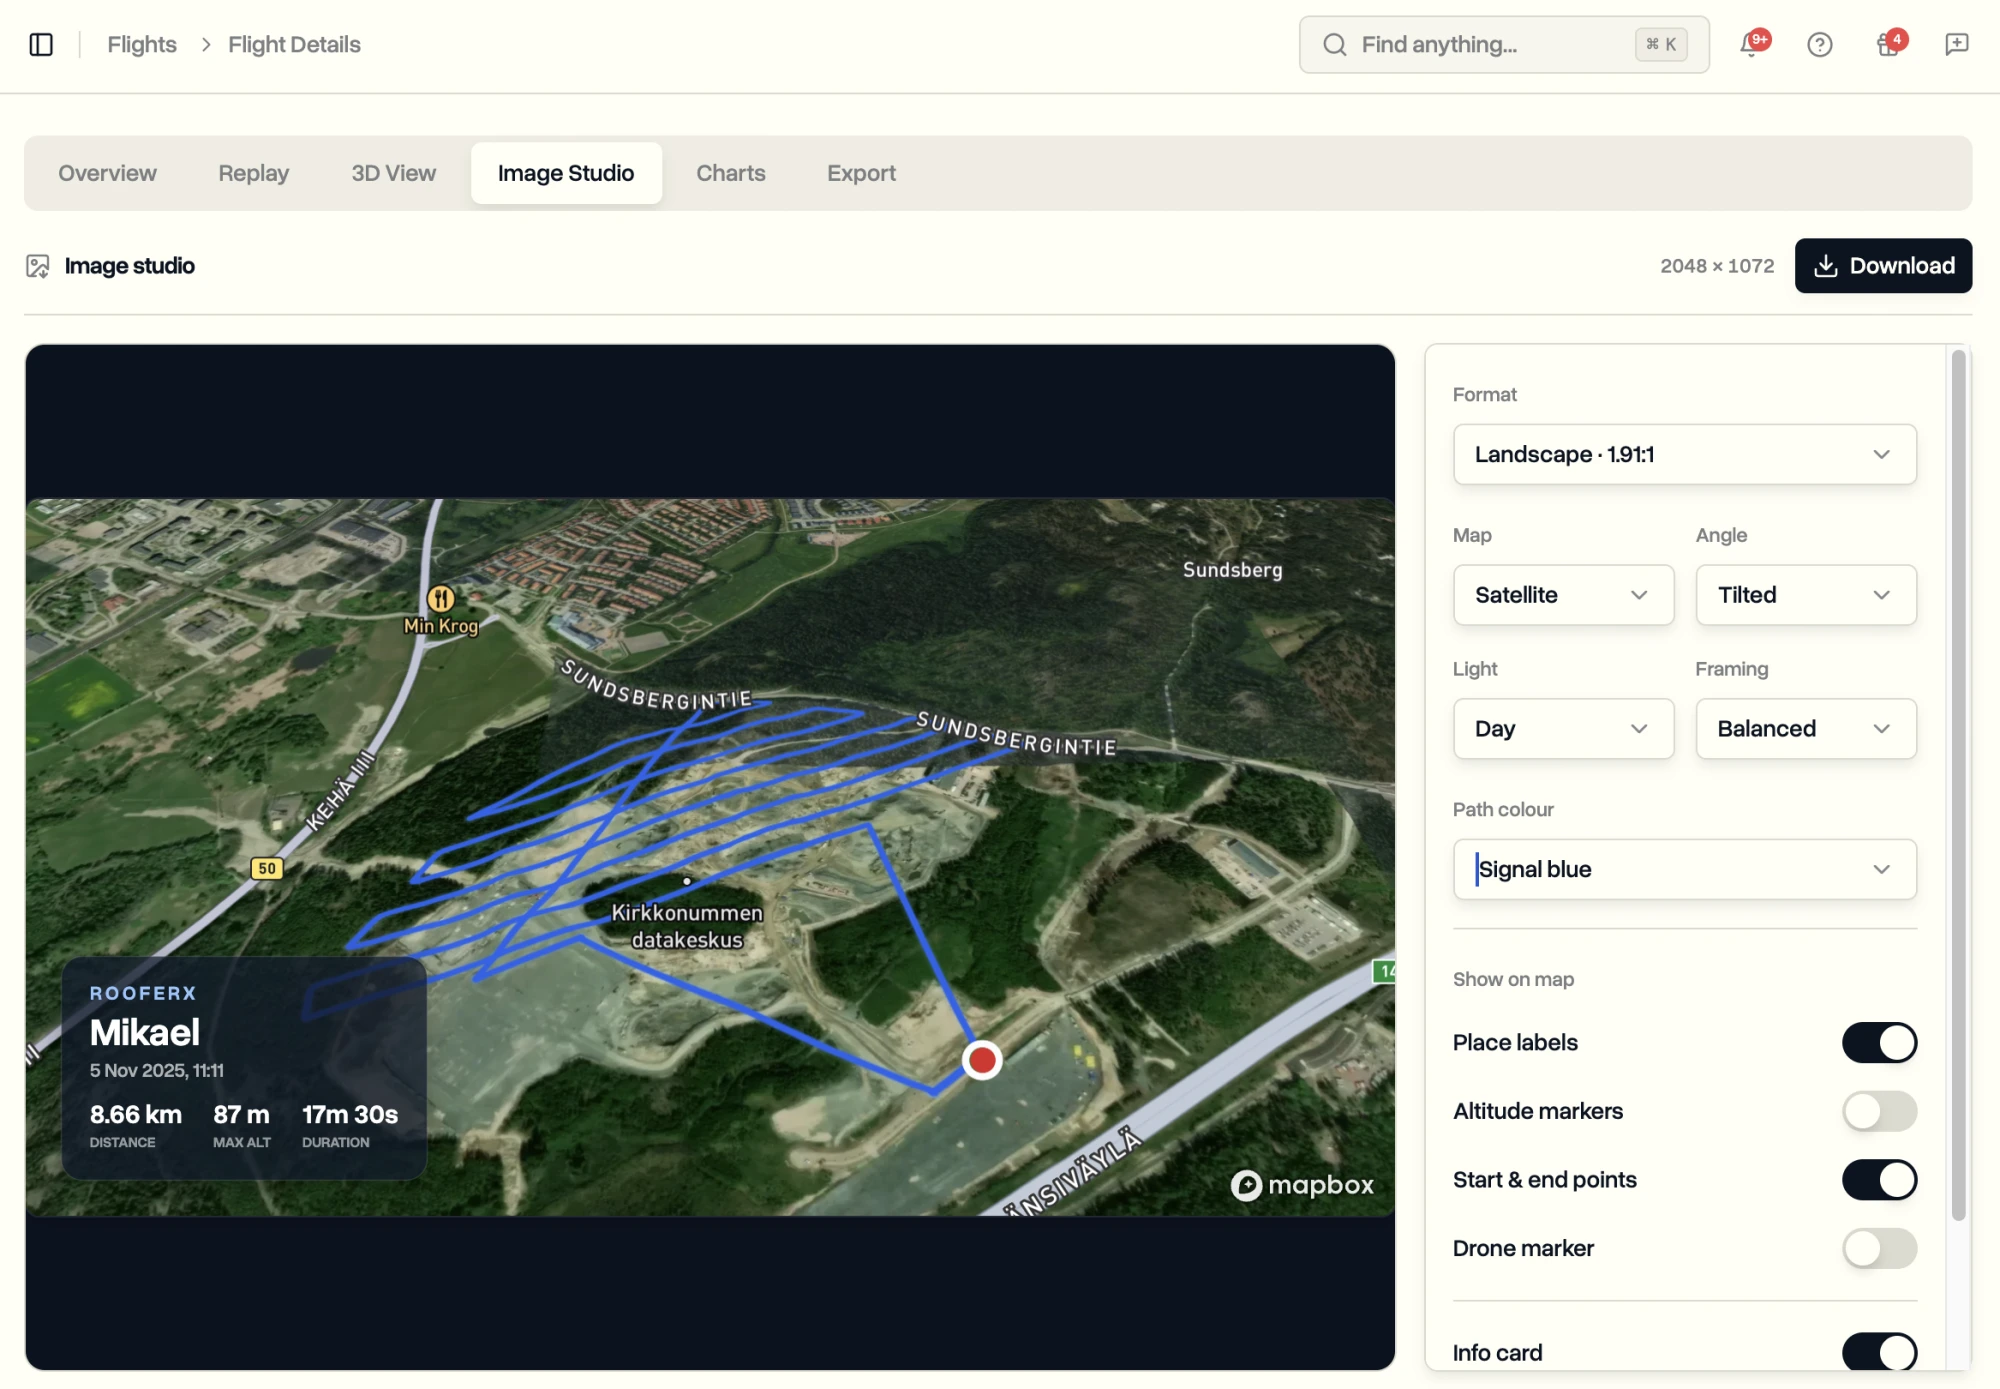
You can switch on start and end points, height markers along the path, and a small info card carrying your company name, the aircraft, the date, and the headline numbers. The card uses your workspace's own company name, so the picture comes out branded as yours. One click downloads it as a high-resolution image, ready to drop wherever it needs to go.
Charts: Read Every Reading Against a Safe Line
Charts is where the detail lives. The readings are grouped the way you would actually look at them, across Performance, Navigation, Battery, Orientation, and, where the aircraft recorded them, Gimbal and Camera. Pick a group and the charts for it stack up underneath, sharing one timeline so everything lines up.
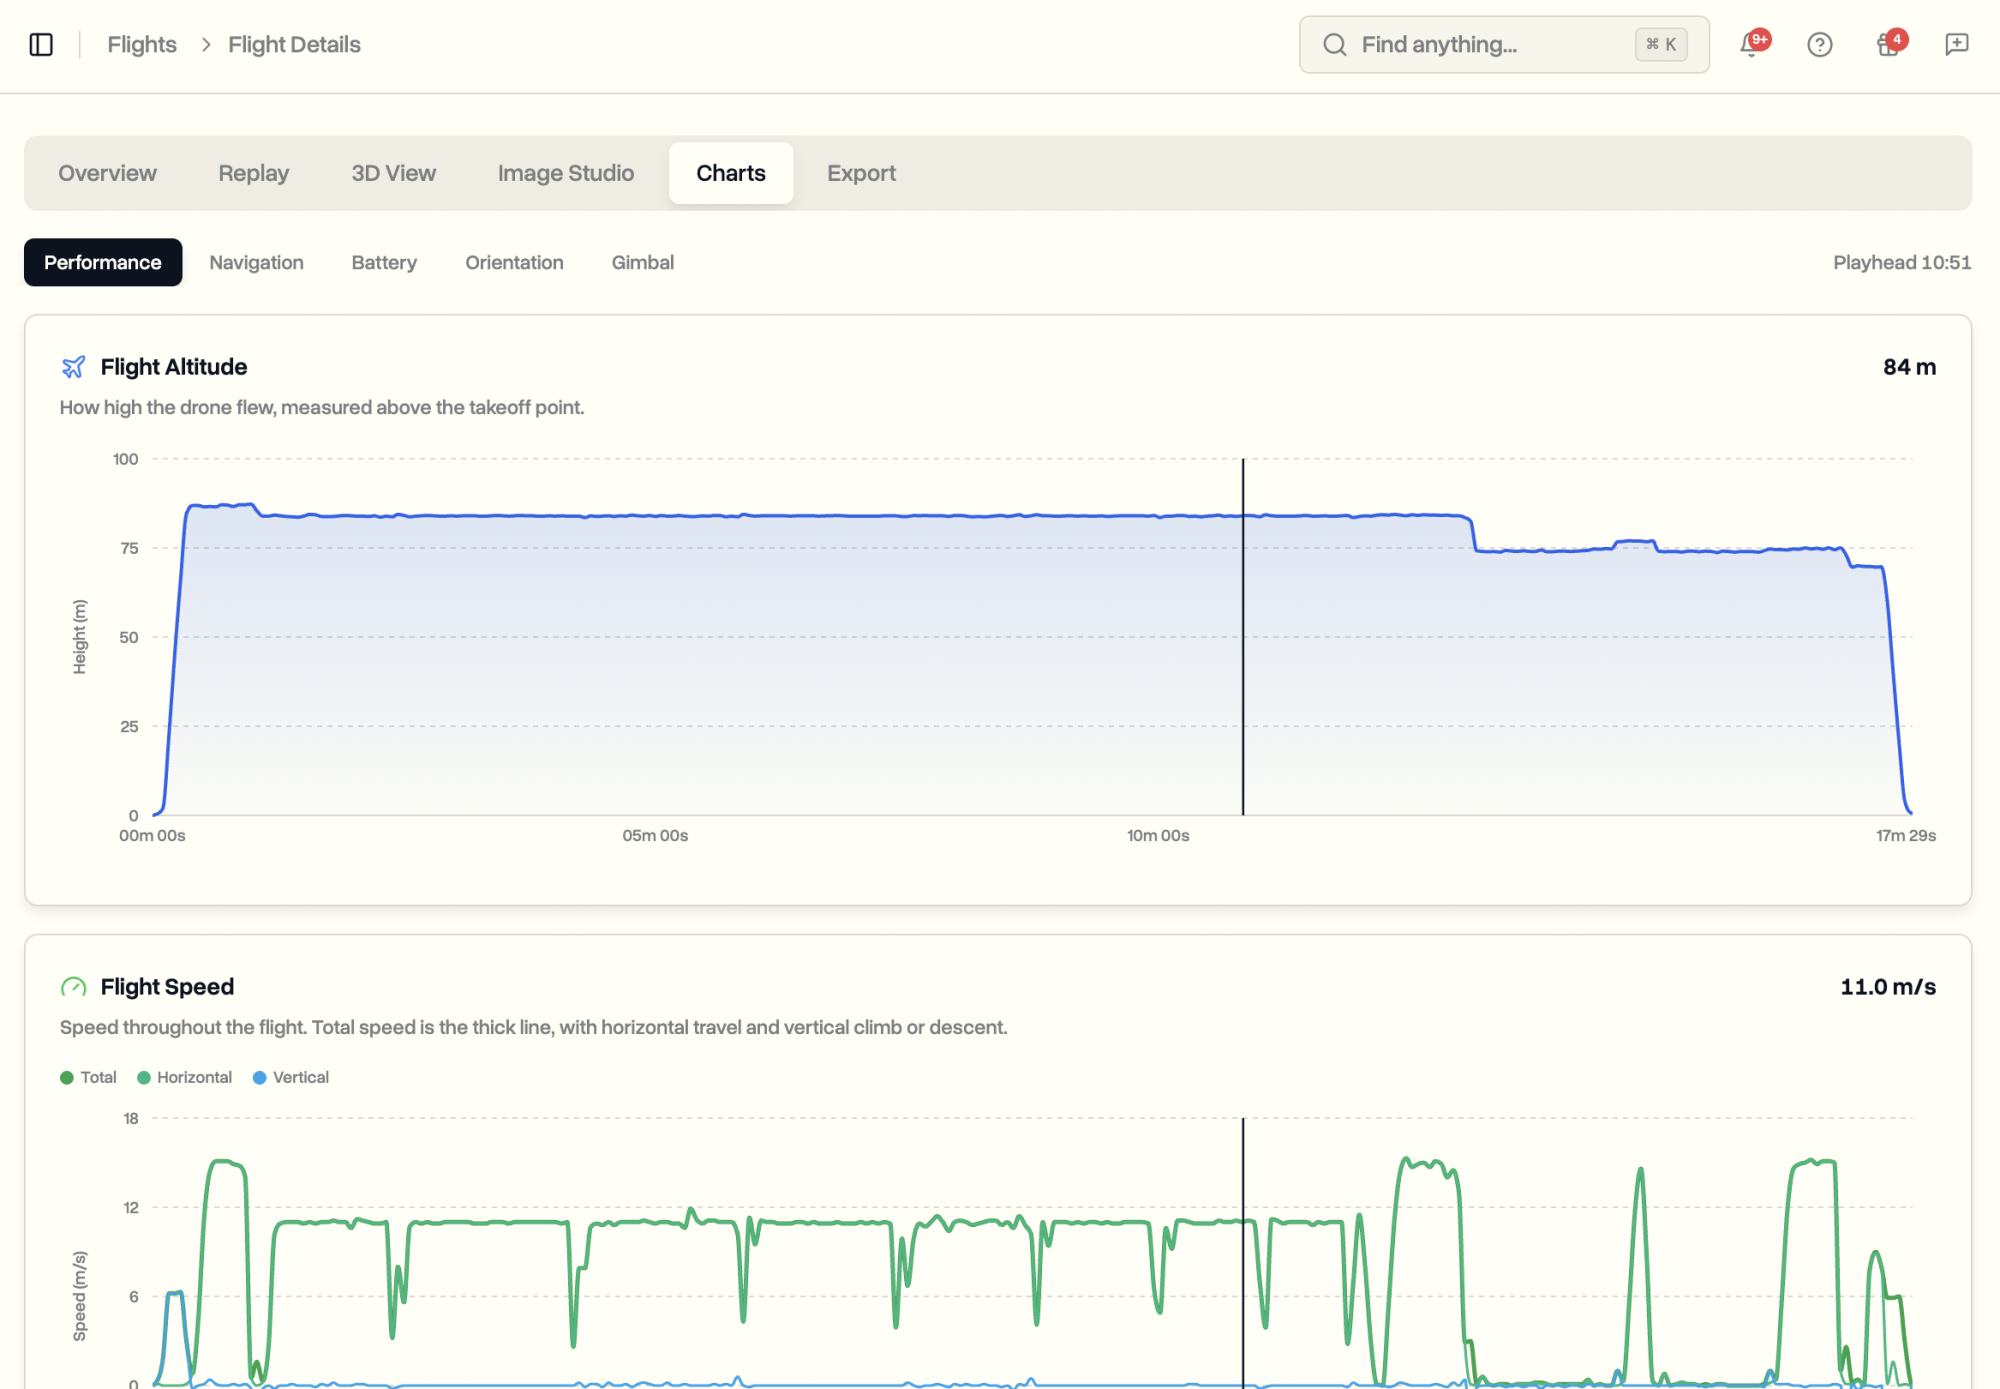
The charts carry sensible reference lines, so a number has context instead of floating on its own. Battery charge shows where you would think about heading home and where it becomes critical. Satellites show the level below which the fix is weak. A playhead runs across every chart together, and you can drag anywhere to read the exact values at that moment, the same playhead the Replay tab uses, so the two stay in step. If the aircraft never recorded something, the page tells you it was not recorded rather than drawing a flat line and pretending. This is the heart of flight data monitoring: the numbers your aircraft already captures, laid out so they mean something.
Export: A Report, a Spreadsheet, or the Raw File
When you need to take the flight out of DroneBundle, the Export tab gives you four ways, each with a preview so you know what you are getting.
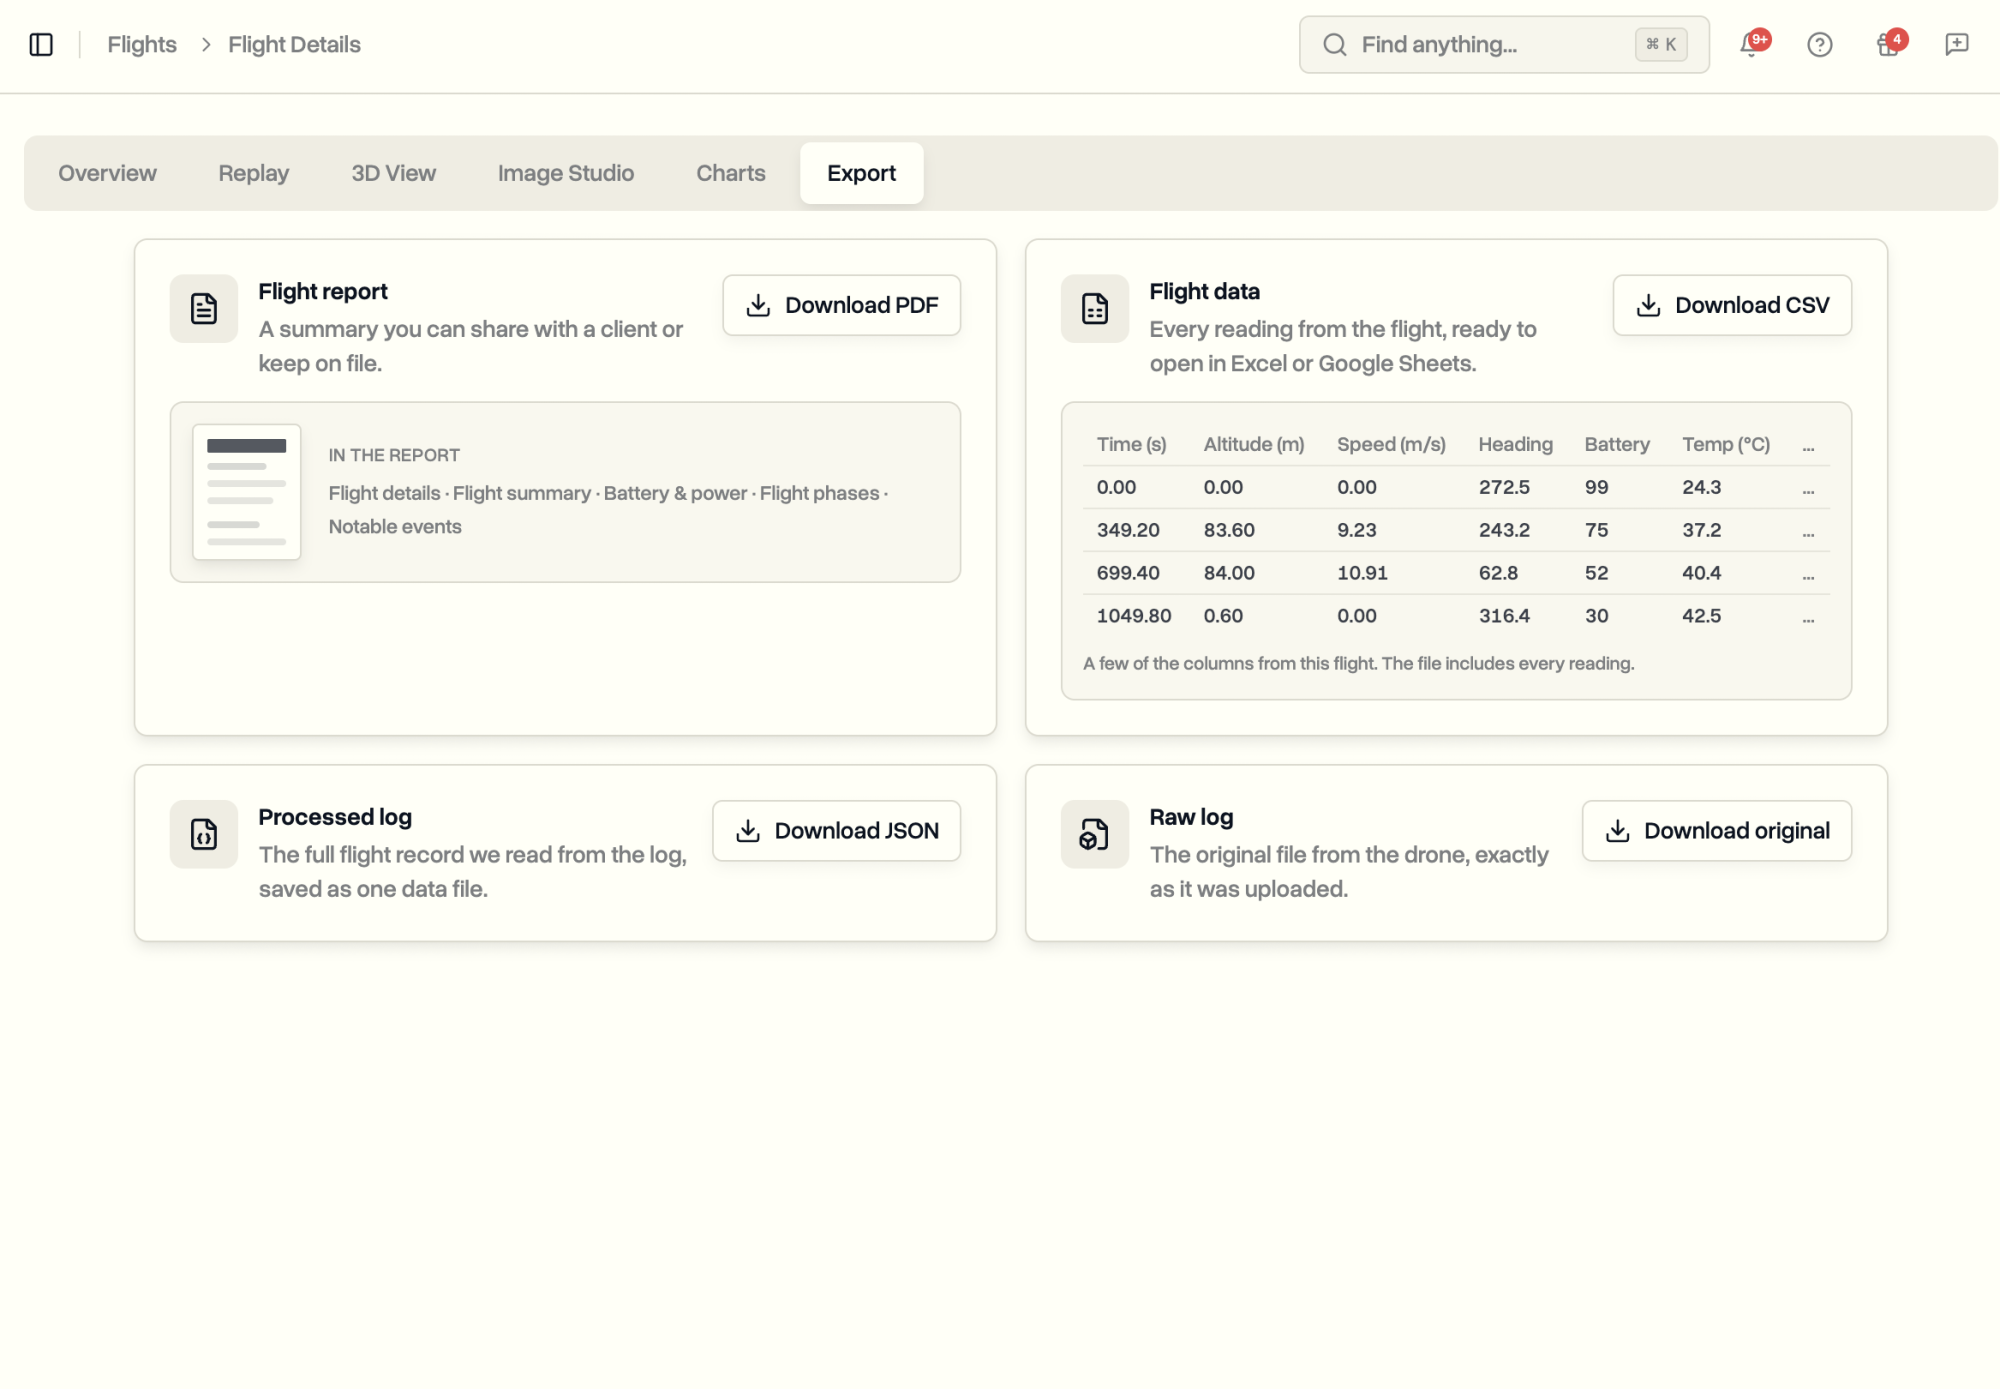
A flight report comes out as a clean PDF covering the flight details, the summary, battery and power, the phases, and the notable events, the kind of document you hand to a client or keep on file. A data file gives you every single reading as a CSV, ready to open in Excel or Google Sheets and slice however you like. The processed log is the full flight record we read from the file, saved as one data file for your own systems. And the original raw file is exactly what came off the drone, untouched, for anyone who wants the source. The report and image both carry your company name, so what leaves the platform looks like it came from you.
Use Cases
Client briefings. Open the 3D View on a call and walk a client through the flight you flew for them, then send the PDF report and a path image afterwards. The work explains itself.
Settling a question after a flight. Something felt off in the air, or a warning came up. Scrub the Replay to that moment, read the charts against the safe lines, and you have the answer in a minute instead of squinting at a spreadsheet.
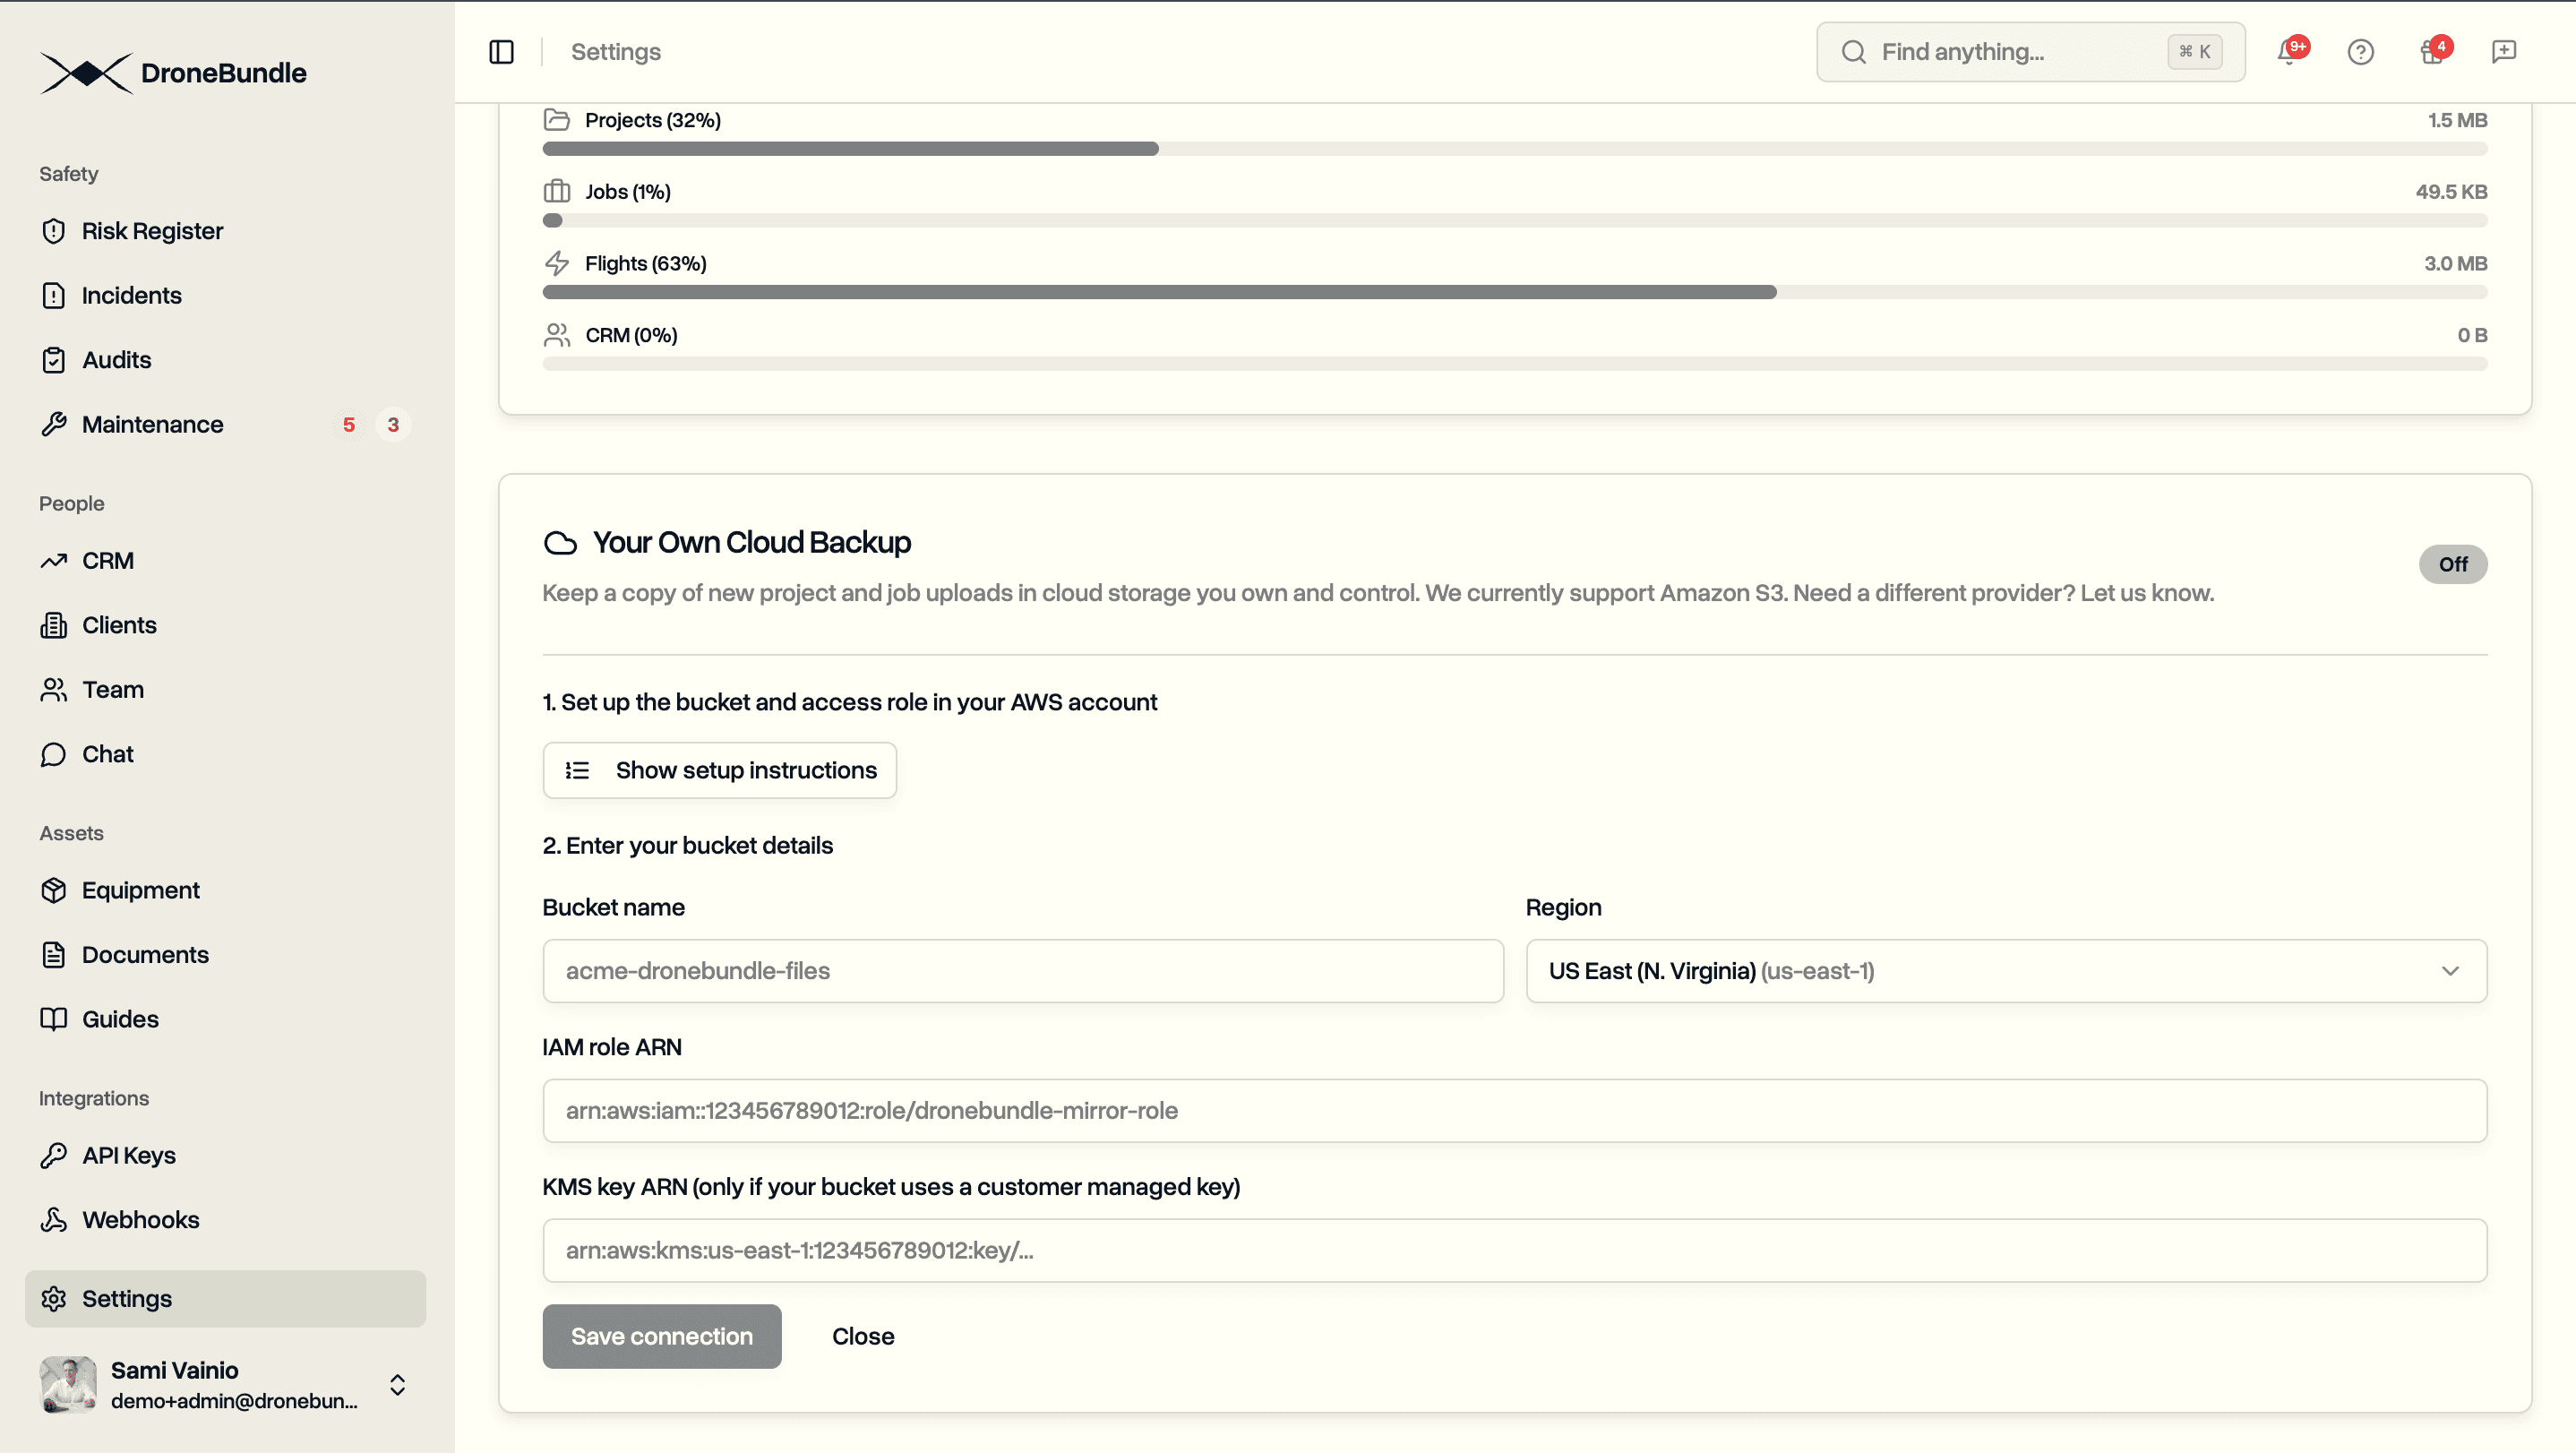
Proof for the record. Keep the report on file alongside your compliance records, or export the data to your own store. Paired with Data Ownership, the raw files and the readings both end up somewhere you control.
Spotting patterns over time. A battery that runs hot, a link that weakens in the same spot, a habit of climbing too fast. The charts make a single flight legible, and reading them across flights is how small problems get caught before they become maintenance ones.
Availability
The rebuilt flight page is available now on every plan, for every flight already in your workspace. There is nothing to switch on. Open any flight and the six tabs are there, and older flights you uploaded long ago get the same treatment, because the page reads the log you already have.
Start your free trial to upload a flight and replay it in 3D.
Book a demo to see how DroneBundle turns your drone flight logs into something you actually open.